Pivot DOTS Indicator for MT4 (with Source Code)
The Pivot DOTS Indicator for MetaTrader 4 (MT4) is a free custom tool that plots daily pivot points, support and resistance levels, and mid-level zones directly on your chart. Originally created by MetaQuotes Software Corp. and later enhanced by IgorAD from Forex-TSD, this indicator remains one of the most useful price structure tools ever made for intraday and swing traders. The version here includes the full MQL4 source code, allowing traders and developers to modify it, re-style it, or integrate it into their own automated systems.
Recommended Brokers for MT4 Traders
For smooth trading and low spreads, we recommend using one of our trusted partners below. Both brokers support MetaTrader 4 and offer fast execution for Forex and synthetic indices.
What the Pivot DOTS Indicator Does
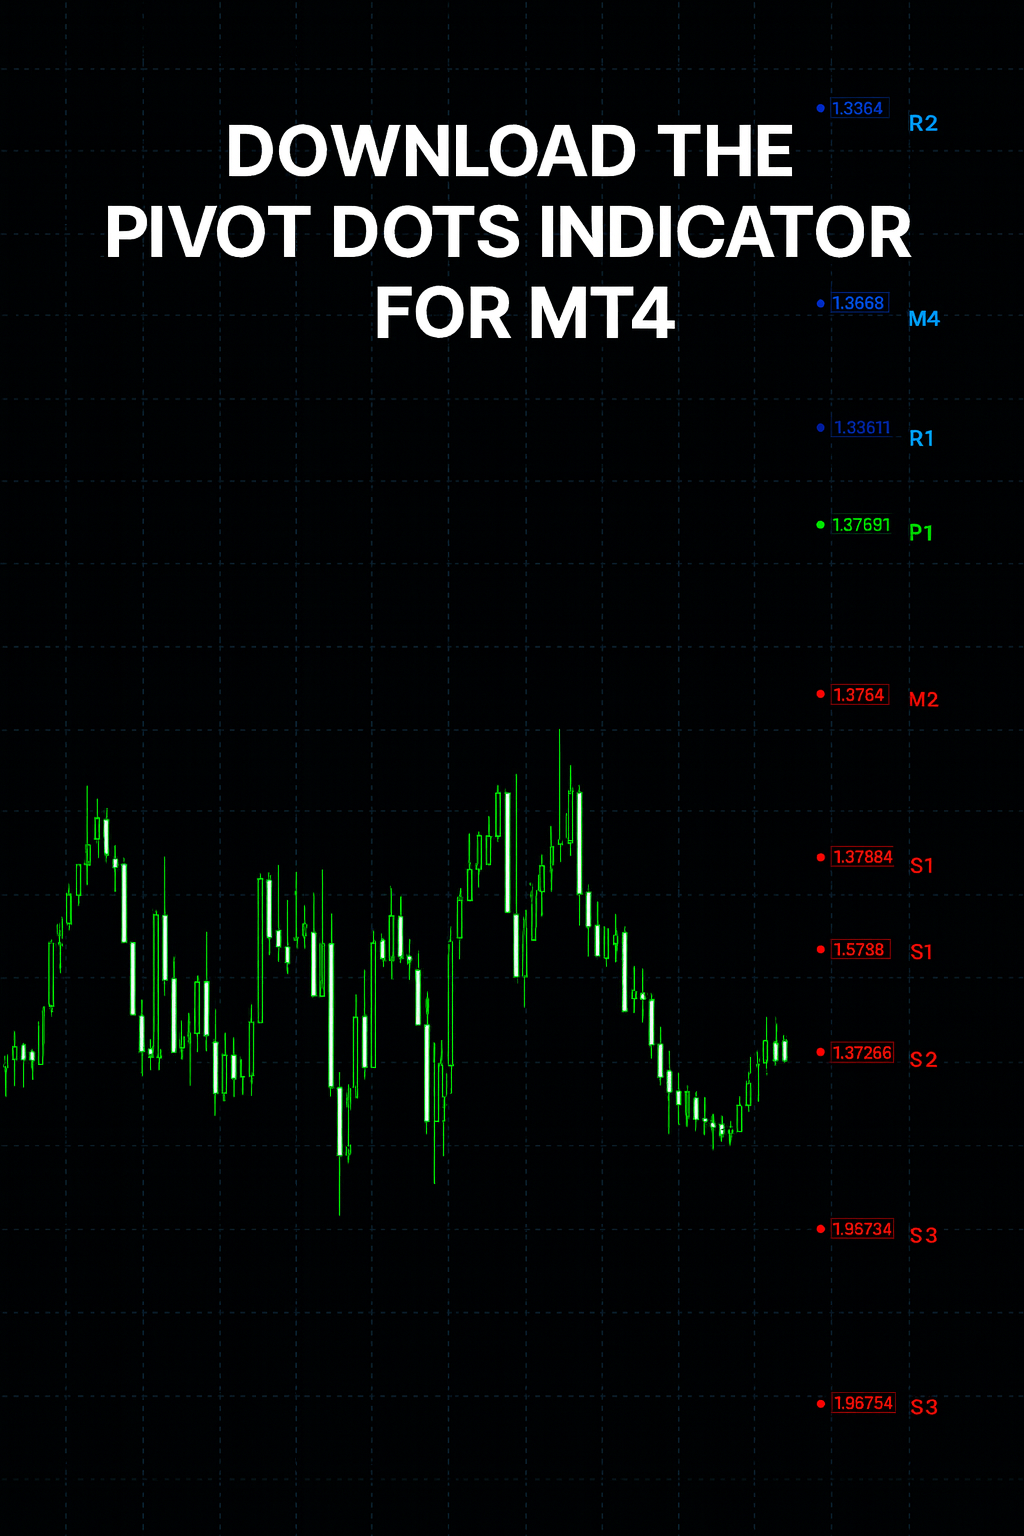
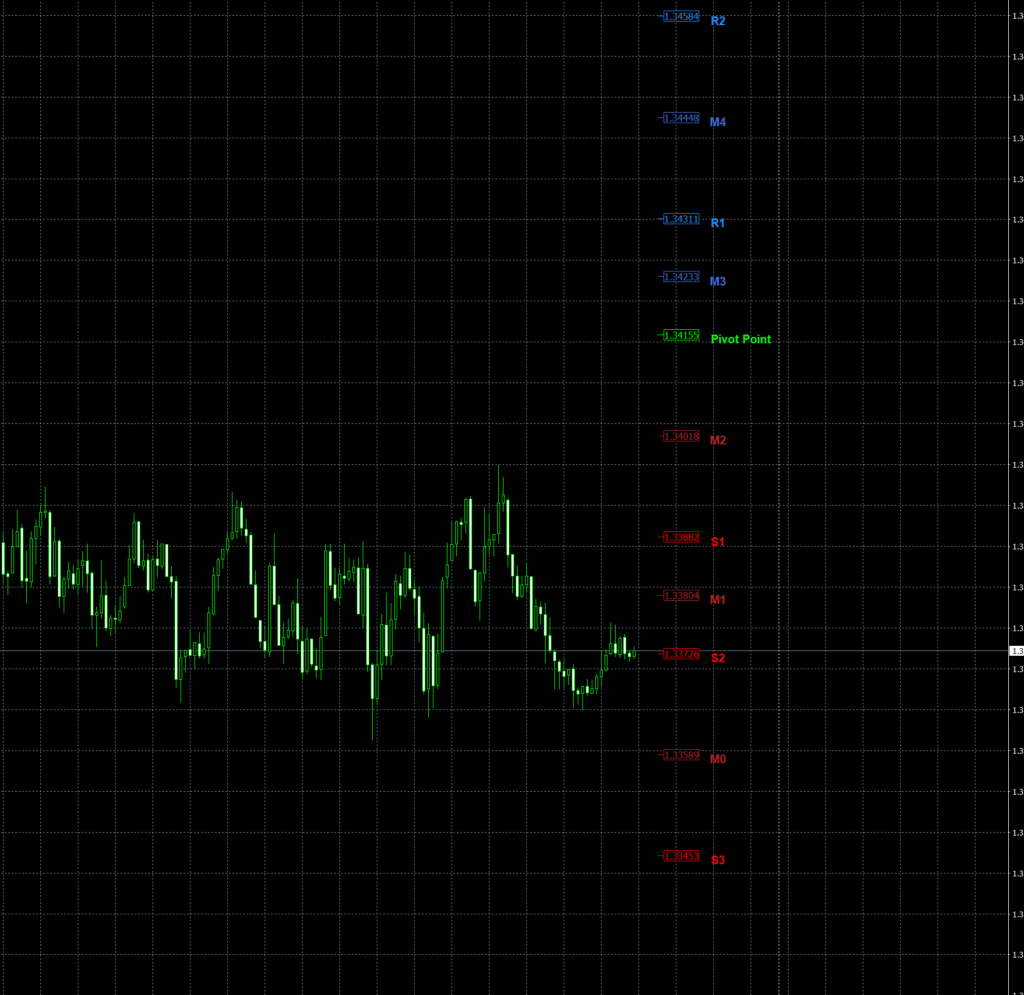
This indicator automatically calculates daily pivot points using the previous day’s high, low, and close values. From that, it plots the main pivot (P) line, three resistance levels (R1, R2, R3), three support levels (S1, S2, S3), and intermediate or “midpoint” levels (M0–M5) between the pivots. The logic behind these levels is based on classical floor trader formulas that identify where price is likely to find balance, rejection, or continuation zones during the trading day.
Each level is drawn as a dot-style marker (instead of horizontal lines), giving a clean, minimalistic visual layout. This makes the chart less cluttered compared to traditional pivot indicators, especially when applied to multiple instruments or timeframes. The pivot dots can be color-coded — typically Lime for central pivot, Blue for resistance levels, and Red for support zones — with mid-levels marked in different shades for distinction.
The idea is simple: pivots act as magnets for price. Traders use them to determine daily market bias.
- When price stays above the central pivot, the day is typically bullish.
- When price remains below the central pivot, the day is bearish.
- Reaction zones around R1/R2 and S1/S2 often reveal profit-taking or breakout continuation zones.

Download the Pivot DOTS Indicator for MT4
You can download both the ready-to-use EX4 file and the editable MQ4 source code for free below.
How It Works Internally
The code uses daily candle data to calculate key levels. It first determines the previous day’s high, low, and close, storing those as variables for pivot computation. Using these values, it computes:
- P = (High + Low + Close) / 3
- R1 = (2 × P) − Low, R2 = P + (High − Low), R3 = (2 × P) + (High − (2 × Low))
- S1 = (2 × P) − High, S2 = P − (High − Low), S3 = (2 × P) − ((2 × High) − Low)
The indicator also computes midpoints (M0–M5) between each major level to create a smooth structure of price reaction zones.
Internally, functions like ObjDel() and PlotLine() handle object creation and deletion to ensure that pivot dots refresh every new day. The script uses ObjectCreate() to draw each arrow (dot) and label. Each label — such as “R1,” “S1,” “Pivot,” or “M3” — is positioned precisely using a small Shift value so that it does not overlap with price bars. The GMT shift input allows traders to align the pivot start time with their broker’s server time or their local session time (useful when analyzing London, New York, or Asian sessions).
The indicator deletes old pivot objects daily using objectdelete all and recreates them for the new trading day. This ensures that traders always see fresh, relevant pivots without historical clutter. Labels can also be toggled off to maintain a minimalistic appearance, while the “Show_StartTime” option draws a vertical line marking the start of the new trading day.
How to Install the Pivot DOTS Indicator on MT4
To install the Pivot DOTS indicator on your MetaTrader 4 platform:
- Open your MetaTrader 4 terminal.
- In the top menu, click File → Open Data Folder.
- Go to the MQL4 → Indicators directory.
- Paste the downloaded file Pivot_DOTS.mq4 or Pivot_DOTS.ex4 into that folder.
- Close the folder and restart MetaTrader 4 to refresh your indicator list.
- Open the Navigator panel (press
Ctrl+Nif hidden). - Right-click on “Indicators” and click Refresh.
- Locate Pivot_DOTS in your custom indicators list.
- Drag and drop it onto any chart.
- Adjust parameters like GMTshift, DOT_Type, Colors, and Label visibility according to your preference.
After loading, you’ll see a grid of color-coded dots representing pivots, supports, resistances, and mid-levels for the current day.
Key Features and Inputs
- GMTshift — Aligns pivot calculations with your broker’s or session time.
- Plot_PIVOTS — Toggles the display of the main pivot and S/R levels.
- Plot_M_Levels — Turns midpoint levels on or off.
- DOT_Type — Controls the shape of the dot marker (arrow code).
- Central_PIVOT / R1_R2_R3 / S1_S2_S3 Colors — Customize your color scheme.
- ShowPivotLabels — Enables or disables the label names like R1 or S2.
- ShiftPivotLabels & AdjustLabel_UP_DN — Fine-tune label positions for visibility.
- Show_StartTime — Draws a vertical line marking the start of the trading day.
Each input gives flexibility for how the indicator appears. For example, many traders prefer only R1/S1 and the pivot line visible to simplify structure, while scalpers often display all mid-levels for finer intraday setups.
How to Use the Pivot DOTS Indicator
Pivot DOTS serves as both a bias filter and a trade planning tool. Here’s how traders typically use it:
1. Determining Daily Bias
Check whether price opens above or below the central pivot (P).
- Above P → look for buy setups.
- Below P → look for sell setups.
This quick check provides immediate directional context for the day.
2. Using Support and Resistance Levels
Price often reacts to R1, R2, S1, and S2. When price hits one of these levels with a reversal pattern, it signals potential exhaustion. When it breaks beyond them, it suggests strong continuation.
3. Intraday Entries and Exits
Scalpers may buy near S1/S2 with tight stops or short near R1/R2. Swing traders may wait for breakouts beyond R2 or S2 to trade trend extensions. The mid-levels (M0–M5) work as micro zones for smaller timeframes (like M5 or M15), identifying interim pullback points.
4. Combining with Other Indicators
Many traders overlay Pivot DOTS with indicators such as RSI, CCI, or Bollinger Bands to confirm momentum. The combination of price structure (pivots) and oscillator divergence often produces strong high-probability entries.
5. Visual Clarity
Unlike line-based pivot tools, the dot visualization makes it easy to see active zones without obstructing candlestick patterns. This is ideal for traders who rely heavily on price action.

Benefits of Using the Source Code (.mq4)
One of the biggest advantages of this version is that it includes the full MQL4 source code. Developers can open it in MetaEditor and explore how each pivot and object is constructed.
You can:
- Change pivot formulas to weekly or monthly levels.
- Modify arrow types and spacing.
- Integrate alerts or notifications when price touches R1/S1.
- Convert it into an Expert Advisor (EA) that trades based on pivot breaks.
- Optimize parameters for synthetic indices or forex pairs.
Having access to editable code transforms this indicator into both a learning resource and a development foundation.
Why Pivot Points Still Work
Pivot points remain a cornerstone of market structure analysis. Institutions, day traders, and algorithms all use them because they are based on universal mathematical levels — not broker-specific data. Even in modern electronic markets, prices often gravitate to pivots, pause, and react.
The psychological aspect is powerful: many traders place their stops, take profits, or pending orders around these levels, making them self-fulfilling zones of liquidity. The Pivot DOTS indicator helps visualize these zones clearly and automatically, saving traders from manually drawing daily levels.
⚠️ Educational Use and Risk Disclaimer
This indicator is provided for educational purposes only. It does not guarantee trading success or profit. All trading involves risk, and you should always test new indicators on a demo account before using them on a live account. If you modify or compile the source code, you are responsible for the results and performance of the version you use.
Download the Pivot DOTS Indicator for MT4
You can download both the ready-to-use EX4 file and the editable MQ4 source code for free below.
Learn More About Pivot Points
These trusted external resources explain how pivot points work, how to calculate them, and how professional traders apply them in forex and synthetic index trading.