TMA Asymmetric Bands Indicator for MT4 – Download & Installation Guide
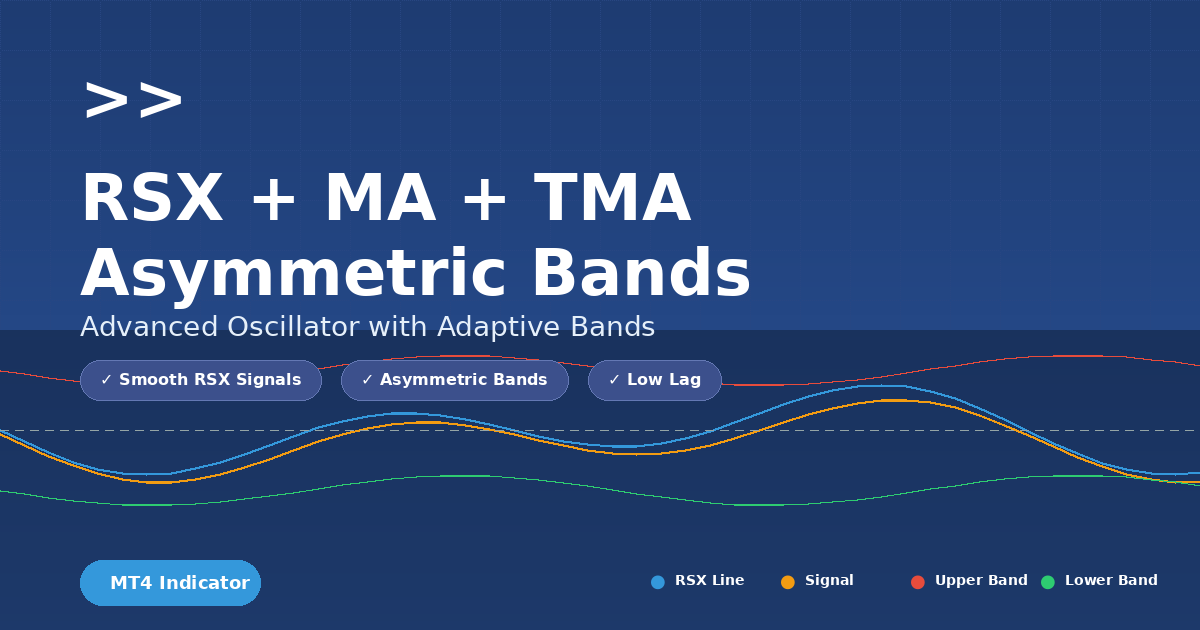
In this post we explore a powerful custom indicator for MetaTrader 4 (MT4) called “ TMA asymmetric bands” developed by Mladen. This indicator brings together three technical components:
- A smoothed momentum oscillator (RSX)
- A moving average (MA) or TMA (Triangular Moving Average) applied to the oscillator
- Asymmetric dynamic bands around that average
The goal: reduce noise, capture clean momentum/trend changes and visually display strength with bands.
If you’re looking for enhanced momentum/trend signals beyond classic RSIs and MAs, this indicator is worth a look.
Recommended Brokers for MT4 Traders
For smooth trading and low spreads, we recommend using one of our trusted partners below. Both brokers support MetaTrader 4 and offer fast execution for Forex and synthetic indices.
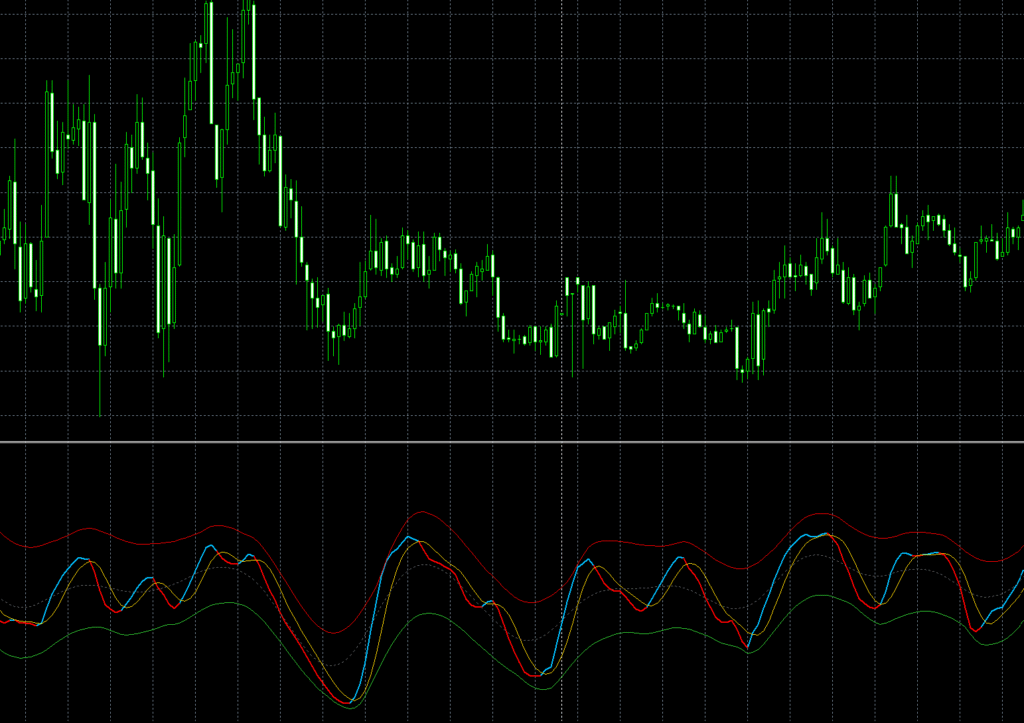
What the indicator does
Here’s a breakdown of how the indicator works:
- RSX calculation – Instead of the classic Relative Strength Index (RSI), the code computes an RSX-style oscillator (Relative Strength Xtra/Quality) that aims to smooth out noise and deliver cleaner momentum signals.
- Signal line (MA) – The RSX line is further smoothed by a simple MA (or the user can choose TMA) of the RSX values (SignalPeriod & SignalMethod parameters).
- TMA applied to oscillator – The indicator also computes a triangular moving average (TMA) of either the RSX or of the MA of RSX (controlled by TmaApplyTo parameter).
- Asymmetric bands – Around the TMA line it plots upper and lower band buffers (upBuffer/dnBuffer) based on deviations. Uniquely it uses separate variance calculations for positive and negative deviations (wrkBuffer[r][wuBuffer] & wdBuffer) which makes the bands asymmetric (the upper and lower bands respond differently to momentum shifts).
- Trend detection & color buffers – It also uses a “trend” buffer that tracks whether the RSX is above or below its signal line, and two buffers (rsxDa / rsxDb) that plot red or green/blue lines depending on the trend (so you see visually when momentum shifts).
So the full package: smoothed oscillator → moving average → averaged TMA → asymmetric bands → trend colouring. The key selling points: smoother momentum, less whipsaw, stronger visual band framework.

Download the Indicator for MT4
You can download both the ready-to-use EX4 file and the editable MQ4 source code for free below.
RSX + MA + TMA Asymmetric Bands
Complete Installation Guide for MetaTrader 4
MT4 CompatibleFollow these simple steps to install and configure the RSX + MA + TMA Asymmetric Bands indicator on your MetaTrader 4 platform. This powerful oscillator combines RSX smoothing with adaptive bands for superior trend analysis.
Download the Indicator
- Download the
.mq4or.ex4file for the indicator - If you have the source code, open it in MetaEditor and compile it to create the
.ex4file - Ensure the file is not corrupted and is from a trusted source
Open the MT4 Data Folder
- Launch your MetaTrader 4 terminal
- Click File → Open Data Folder from the menu bar
- Navigate to
MQL4 → Indicators
Ctrl + Shift + D as a keyboard shortcut to open the data folder directly.
Paste the Indicator File
Copy the downloaded .ex4 or .mq4 file into your Indicators folder:
C:\Users\YourName\AppData\Roaming\MetaQuotes\Terminal\InstanceID\MQL4\IndicatorsReplace YourName with your Windows username and InstanceID with your MT4 installation ID.
Restart MT4 or Refresh Navigator
You have two options to load the new indicator:
- Option A: Completely restart the MetaTrader 4 terminal
- Option B: Right-click inside the Navigator panel and choose Refresh
The indicator will now appear under Indicators → Custom in the Navigator window.
Attach to a Chart
- Open any chart (e.g., EURUSD, XAUUSD, Volatility 75 Index)
- In the Navigator panel, expand Indicators → Custom
- Find RSX + MA + TMA Asymmetric Bands in the list
- Drag and drop it onto your chart
- The input settings window will pop up automatically
Adjust Indicator Settings
Default Parameters
Modify these settings according to your trading instrument and timeframe, then click OK.
Customize the Appearance
Make the indicator visually appealing and easy to read:
- Right-click inside the indicator sub-window
- Select Indicators List
- Double-click on RSX + MA + TMA to open properties
- Go to the Colors tab
Recommended Color Scheme
Save as a Template
Save your configuration for easy reuse across multiple charts:
- Right-click anywhere on the chart
- Select Template → Save Template
- Name it
RSX_TMA_Bands.tpl - Click Save
Now you can apply this template to any chart with one click!
Optional: Add Custom Alerts
Want MT4 to alert you when RSX crosses its signal line or hits a band? Follow these steps:
- Open the indicator source code in MetaEditor
- Add alert code in the appropriate section:
// Add these lines in the main calculation loop
if (rsx[i] > signal[i] && rsx[i+1] <= signal[i+1])
   Alert("RSX Buy Signal on ", Symbol());

if (rsx[i] < signal[i] && rsx[i+1] >= signal[i+1])
Alert("RSX Sell Signal on ", Symbol());- Click Compile (F7) in MetaEditor
- Reload the indicator on your chart
Pro Trading Tips
- Use on H1–H4 timeframes for smoother, more reliable signals
- Combine with price action patterns or support/resistance zones for better confirmation
- Avoid cluttering your chart with too many indicators – keep it clean and focused
- For synthetic indices (e.g., Volatility 75, Crash 500), try RsxPeriod = 20 and BandsDeviations = 2.0–2.5
- Oversold/Overbought: Enter when RSX bounces from the bands, not just when it touches them
- Consider using the TMA middle line as a dynamic equilibrium level for exits
- Backtest thoroughly before using in live trading – every market behaves differently
- Pair with proper risk management: never risk more than 1-2% per trade
Why use RSX + MA + TMA asymmetric bands?
Here are the main benefits:
- Reduced noise: Classic RSI is prone to whipsaws and many false signals. The RSX style oscillator is designed to filter that and deliver a cleaner line.
- Better trend/momentum clarity: With the MA (or TMA) applied to the RSX, you get a signal line for crossovers (RSX vs signal). Crossovers often help spot momentum change.
- Dynamic band context: The asymmetric bands provide context – when price oscillator stretches far above the TMA (upper band) or falls far below (lower band), it suggests strong momentum or potential reversal.
- Visual trend cues: The indicator uses buffers to change colour when momentum shifts. That helps visually identify trend states (bullish vs bearish) without relying purely on price.
- Flexibility: The user has parameters: RSX period, price source, signal period/method, TMA half-length, choice of applying TMA to RSX or to MA of RSX, and band deviations. That allows adaptation to multiple timeframes and assets.
For traders who want both momentum and trending context (rather than just trend-following or just oscillating), this hybrid indicator offers a useful tool.
Key parameters explained
Here are the main external inputs and what they mean:
- RsxPeriod (=14 by default): The look-back period for the RSX oscillator. A shorter period = more sensitivity, more noise; longer period = smoother/later signals.
- RsxPrice (=0 by default): Price source (0 might mean close price, depending on implementation).
- SignalPeriod (=5): The period for the moving average of RSX to create a signal line.
- SignalMethod (=MODE_SMA): Type of MA used for the signal line (e.g., SMA, EMA, etc.).
- TmaHalfLength (=12): This controls the TMA smoothing: full length = 2×TmaHalfLength+1. A higher value = smoother average, less responsive.
- TmaApplyTo (=0 or 1): If 0 → apply TMA to RSX values; if 1 → apply TMA to the MA of RSX (signal). Choosing 1 may produce smoother bands around the signal rather than raw oscillator.
- BandsDeviations (=2.8): Multiplier for band width. The indicator uses the squared deviations (variance) separately for positive and negative deviations, takes square root → gives standard‐deviation style measure, and multiplies by this parameter. Higher value = wider band (less frequent breaks).
Understanding these parameters is key before you deploy it; some adjustment per asset/timeframe is advisable.
How to interpret & trade it
Here’s how you might use the indicator in practice:
Interpretation
- When RSX (blue line) crosses above its signal line (yellow), that signals increasing bullish momentum → trend buffer becomes +1, colour shift likely to green/blue.
- When RSX crosses below the signal, bearish momentum takes over → trend = -1, colour shift to red.
- The TMA line (tmBuffer) defines a “centre” for the oscillator. The asymmetric bands (upBuffer & dnBuffer) show how far the oscillator has deviated.
- RSX values nearing the upper band suggest strong momentum — could be continuation or exhaustion.
- RSX values nearing the lower band suggest strong bearish momentum or oversold/turning zone.
- Because the bands are asymmetric, the lower band may behave differently (wider or narrower) than the upper band depending on recent deviations. That helps adapt to trending vs ranging context.
Possible trading strategies
- Momentum entry: Enter when RSX crosses the signal line in the direction of trend and perhaps touches or breaks a band. Example: RSX crosses above signal → momentum turning bullish → price/oscillator near lower band and moving up → go long.
- Band breakout: If RSX breaks above upper band, that can indicate very strong momentum; either ride the trend or watch for possible exhaustion/reversal.
- Band reversion: If RSX climbs sharply to the upper band and then fails or reverses, that may signify exhaustion. Similarly for lower band in down moves.
- Trend filter: Use the “trend” buffer (trend=+1 or -1) to filter only trades in the direction of the momentum. I.e., only take long signals when trend=+1, short only when trend=-1.
- Multi-timeframe confirmation: Use the indicator on a higher timeframe to establish the trend buffer, then on a lower timeframe to fine-tune entries. Because the indicator is smoother, it can reduce false signals when markets are noisy.

Best practices & caveats
- Combine with price structure – No indicator is perfect. Use support/resistance, price action, volume to validate signals (especially when RSX touches band).
- Beware ranging markets – Even smoothed oscillators can produce false breaks in a non-trending market. The asymmetric bands help, but still consider market context.
- Parameter tuning per instrument – A one-size-fits-all setting may not work for all assets/timeframes. For example, stock indices might need a longer RSXPeriod, while forex pairs in M5 might need shorter.
- Use stop-loss/management – When RSX stretches far beyond a band, a strong move may be underway, but reversal risk increases. Have risk controls.
- Understand lag vs sensitivity trade-off – A higher TMA half-length (smoother) means fewer false signals but slower reaction. If you need quicker signals (e.g., intraday), reduce TmaHalfLength but expect more noise.
- Test historically – Back-test and forward-test the indicator on the specific instrument and timeframe you intend to trade. Use alerts when RSX crosses signal or touches bands.
- Not standalone – Always use in conjunction with other elements (trend filter, price behavior). The indicator gives good information, but you still need a trading plan
Summary
The “RSX + MA + TMA asymmetric bands” indicator by Mladen is a sophisticated tool that blends a smoothed momentum oscillator (RSX), a signal moving average, and asymmetric dynamic bands around a triangular moving average, giving traders:
- Cleaner momentum signals
- Visual trend/momentum context with bands
- Flexibility to adapt to different assets and timeframes
- Better filter against noise and whipsaw
While no indicator is a magic bullet, when used properly—as part of a broader strategy with price structure, risk management and confirmation—it can enhance the clarity of entries/exits and improve trade discipline.
Download the Indicator for MT4
You can download both the ready-to-use EX4 file and the editable MQ4 source code for free below.