Market Profiles.mq4 — Forex Session Boxes & High-Low Range Indicator for MT4 (Updated 2025)
If you love trading with session structure—Asia, London, and New York—the Market Profiles.mq4 indicator is a clean, lightweight way to shade trading sessions and optionally snap the rectangles to session high/low. Originally attributed to MetaQuotes / KimIV, with styling tweaks by cja, this tool draws colored rectangles across the last N days so you can instantly read where ranges built and where breakouts came from.
Why it matters: session context helps frame breakout trades, reversions, and overlaps (e.g., London–New York), which often drive volume and directional moves.
Recommended Brokers for MT4 Traders
For smooth trading and low spreads, we recommend using one of our trusted partners below. Both brokers support MetaTrader 4 and offer fast execution for Forex and synthetic indices.
What the indicator does
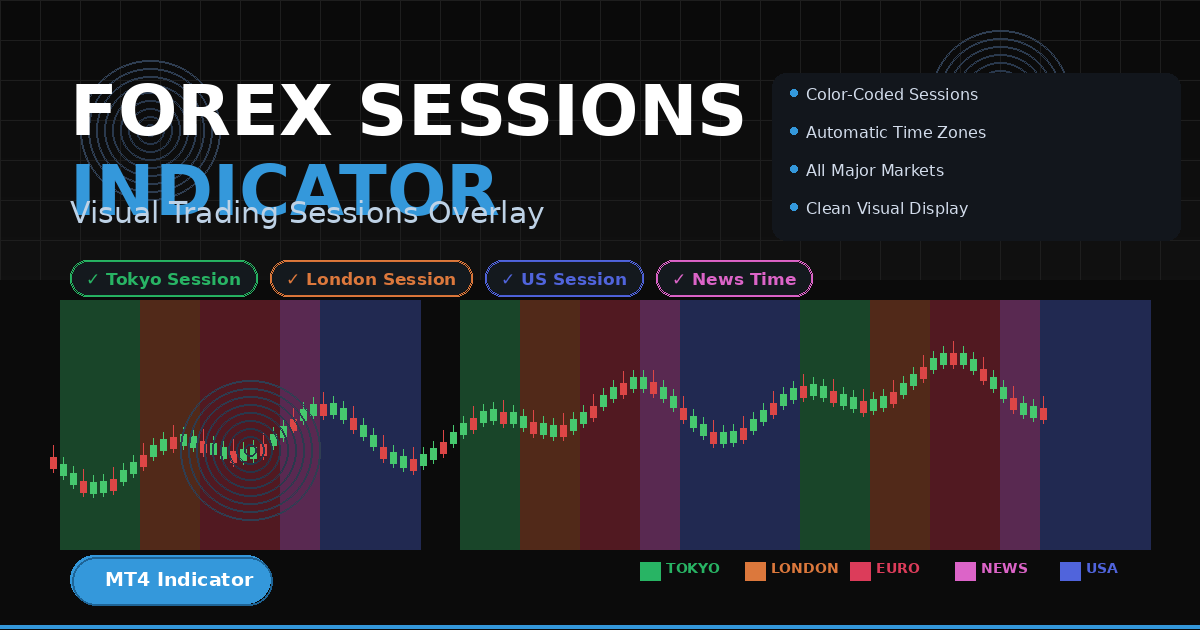
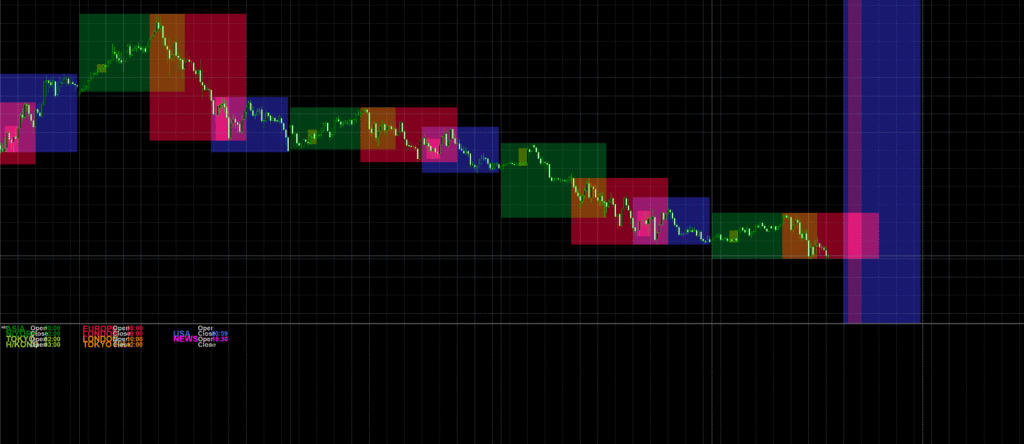
- Draws separate rectangles per day for defined sessions (Asia, Europe/London, US, plus special overlaps like “London Open–Tokyo Close”, “US Open–London Close”, “News” window).
- You can choose to snap boxes to the session’s true high/low, or fill the full price height of your sub-window (via
HighLowflag). - Uses object labels in the indicator sub-window to show session names and times.
- Lets you set number of days to display (
NumberOfDays). - Every session has its own Start/Stop time and color, so you can tailor your map to your broker timezone and style.
Key features (at a glance)
- Session mapping: Asia, Europe (London), US, and custom windows like overlaps & news slots.
- High/Low mode: When
HighLow = true, each session’s rectangle vertically spans that session’s high to low. - Lightweight & visual: Only uses rectangles and labels; doesn’t slow down your charts.
- Daily look-back: Control how many days to mark (
NumberOfDays). - Custom colors: Set distinct colors for instant visual scan.

Download the Indicator for MT4
You can download both the ready-to-use EX4 file and the editable MQ4 source code for free below.
How it works (under the hood)
- On init, the indicator:
- Sets the short name
Mktfor the separate window. - Deletes any prior session rectangles, then creates a bank of rectangles for each session for the last
NumberOfDays.
- Sets the short name
- On start, it:
- Prints a small legend (“ASIA = Green, EUROPE = Red, USA = Blue”).
- Writes label objects for session names & times in the sub-window.
- For each of the last
NumberOfDays:- Calls
DrawObjects()per session to position each rectangle between Start and Stop times. - Uses
iBarShift()to get bar indexes matching the session time window. - Calculates the session high and low with
Highest / Lowestacross the bar range. - If
HighLow == true, sets rectangle top/bottom to that high/low; else uses a full-height fill.
- Calls
- Steps backward using
decDateTradeDay()while skipping weekends to get prior trading days.
Note on time: It composes times with StrToTime(TimeToStr(dt, TIME_DATE)+" "+Start/Stop)—so your terminal timezone matters; adjust Start/Stop accordingly for your broker/server time.
Inputs you can tune
NumberOfDays = 10— How many past days to draw.Start_1 ... Start_7/Stop_1 ... Stop_7— Session start/stop times (strings like"08:00").Colour_1 ... Colour_7— Colors for each session.HighLow = true— Iftrue, rectangles snap to session high/low; iffalse, rectangles fill the sub-window vertically.
Sessions in this template
Colour_1US,Colour_2Europe,Colour_3AsiaColour_4London Open – Tokyo Close (overlap)Colour_5US Open – London Close (overlap)Colour_6Tokyo–Hong Kong openColour_7“News” window
(Two extra sessions8and9are present but commented out.)
Important code notes (fix these for clean compiling)
- RGB limits: MQL4 color literals
C'R,G,B'must be 0–255. Your snippet has values likeC'549,111,0',C'268,0,136',C'438,90,238'which exceed 255 and can cause invalid colors.- Suggested replacements:
C'549,111,0'→C'236,130,0'(orange)C'268,0,136'→C'168,0,136'(magenta/purple)C'438,90,238'→C'138,90,238'(blue-violet)
- Suggested replacements:
- Object IDs: The code creates many labels (e.g.,
"MKT","b0MKT","MKT1", …). If you load multiple copies on the same chart, IDs will clash. Consider prefixing with the chart ID or indicator handle if you’ll use multiples. - Window placement: It draws labels with
WindowFind("Mkt"). If you rename the short name, update this reference. - Full-height mode: In
DrawObjects(), the lineif (!HighLow) { p1=0; p2=2*p2; }is a hack. For a clean full-rectangle fill, set a fixed top/bottom usingWindowPriceMax()andWindowPriceMin()or draw in the main chart window with price coordinates andOBJPROP_BACK = true.
How to install (MT4)
- Open MT4 → File → Open Data Folder
- Go to MQL4 → Indicators
- Paste Market Profiles.mq4 (or compiled
.ex4) into the folder - Restart MT4 or right-click Navigator → Refresh
- Drag Market Profiles from Navigator → Indicators → Custom onto your chart
- Set your Start/Stop times to match broker time; choose colors; set
HighLowmode → OK
Practical usage ideas
- Asia range → London breakout: Mark the Asia box; trade London breakouts beyond the session high/low.
- Overlap momentum: The US–London overlap (e.g.,
15:00–19:00server time in this preset) often has the highest volume—use that rectangle to concentrate your strategies. - News window isolation: Use the “NEWS” session box to avoid whipsaws or to plan fade/continuation plays post-release.
- Mean reversion: If price expands far beyond a session box and re-enters, watch for reversion back to the box midline or opposite edge.
- HTF/MTF confluence: Keep H1/H4 boxes for context; execute on M5–M15 with tighter risk.

Pro tips for cleaner charts
- Use muted fills (e.g., set low opacity colors) so price remains visible.
- Keep NumberOfDays modest (5–15) to avoid clutter.
- Align session times to your broker’s server—DST shifts can alter overlaps; update times seasonally if needed.
- Pair with structure tools: Previous Day High/Low, VWAP, or a session midpoint line for added precision.
Troubleshooting
- Boxes don’t show: Ensure your chart timeframe has enough history to cover
NumberOfDays× sessions; check Start/Stop times are within your broker day. - Colors look wrong: Replace any
C'R,G,B'values > 255 with valid RGB (0–255). - Misaligned session windows: Your broker/server timezone is different—offset
Start/Stopby the difference from your intended session time (consider DST).
Conclusion
The Market Profiles.mq4 indicator for MT4 provides a simple yet powerful way to visualize global trading sessions — Asia, London, and New York — directly on your chart. By highlighting these time blocks with colored rectangles, traders can instantly see when volatility shifts, overlaps occur, and where the day’s liquidity builds up. Whether you trade breakouts from the Asian session or momentum during the London–New York overlap, this indicator helps you time your trades with more precision. Adjust session times for your broker’s timezone, choose your favorite colors, and you’ll have a clear, structured view of the market rhythm every day.
FAQ — Market Profiles MT4 Indicator
Does the Market Profiles indicator repaint?
No — the indicator draws static rectangles based on fixed session times. Once a day’s session box is drawn, it remains unchanged unless you alter the Start/Stop times or refresh the chart.
Why are some session boxes misaligned?
Session times are calculated using your broker’s server time.
If the boxes appear offset, simply adjust the Start_x and Stop_x inputs to match your preferred time zone
or daylight saving schedule.
Can I add more sessions or change colors?
Yes! You can duplicate one of the existing Start_x / Stop_x / Colour_x blocks in the code
and assign it a new label or time range. You can also use any RGB color value within the 0–255 range for custom styling.
Does it slow down MT4?
Not at all. The script uses simple rectangle objects — no loops on every tick — making it extremely light even when displaying multiple days of session data.
Can I use it on synthetic indices or gold?
Yes, you can. Just remember that non-forex markets may have different trading hours, so adjust the session times to match the instrument’s activity zones for best visual accuracy.
⚠️ Disclaimer
The Market Profiles.mq4 indicator is provided for educational and analytical purposes only. It does not constitute financial advice or a guaranteed trading system. Past performance of any trading tool or indicator is not indicative of future results. Always test indicators on a demo account before using them with real funds.
Forex and synthetic index trading involve significant risk and may not be suitable for all investors. By downloading or using this indicator, you agree that the developer and website are not responsible for any losses, damages, or decisions made based on its use. Trade responsibly and always apply sound money management.
Download the Indicator for MT4
You can download both the ready-to-use EX4 file and the editable MQ4 source code for free below.