Polynomial Regression Channel for MT4 — Smooth Trend Line with Deviation Bands
Download a free Polynomial Regression Channel indicator for MetaTrader 4 (MT4). It plots a fitted regression line with upper and lower standard-deviation bands to visualize trend direction and volatility. Fully customizable degree, lookback, and band width.

Unlike typical regression or moving-average tools that smooth data mechanically, this indicator fits its levels directly to real price movement, creating a clean, adaptive channel that responds instantly to changing volatility. Whether you trade major Forex pairs, commodities like gold and silver, or synthetic markets, it automatically adjusts to the character of each instrument, keeping your analysis both precise and responsive
Recommended Brokers for MT4 Traders
For smooth trading and low spreads, we recommend using one of our trusted partners below. Both brokers support MetaTrader 4 and offer fast execution for Forex and synthetic indices.
What this indicator does
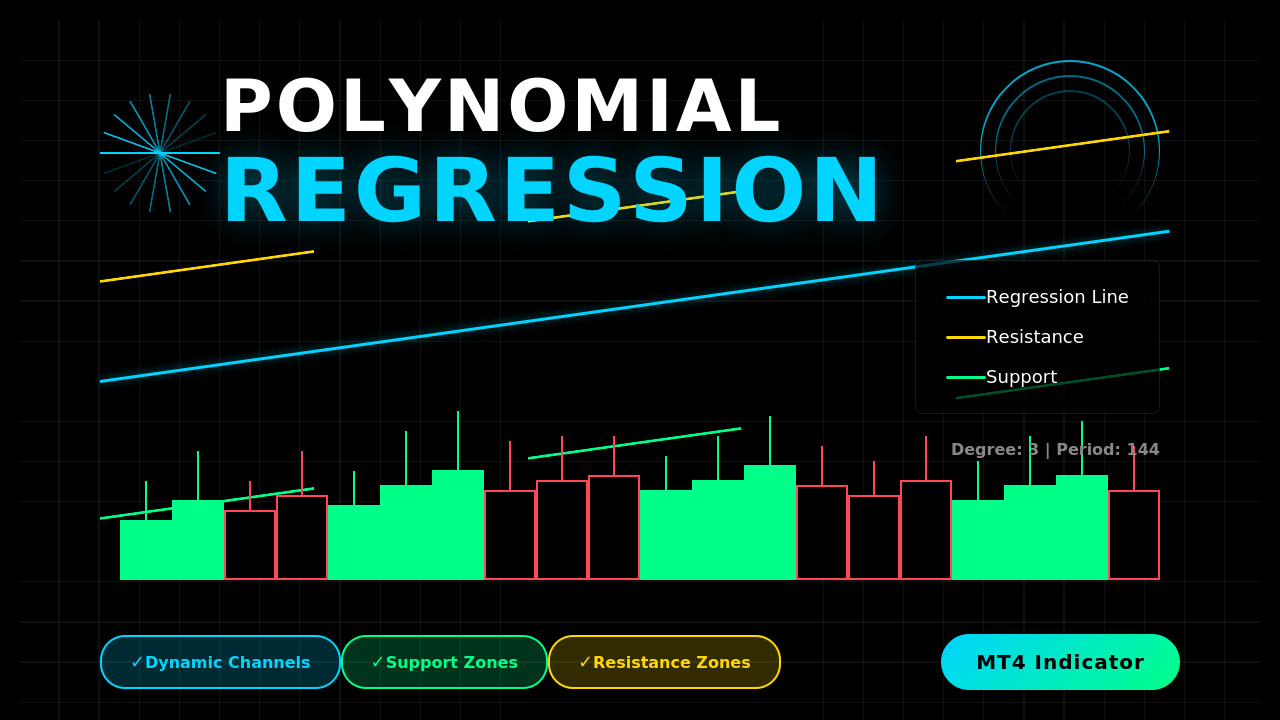
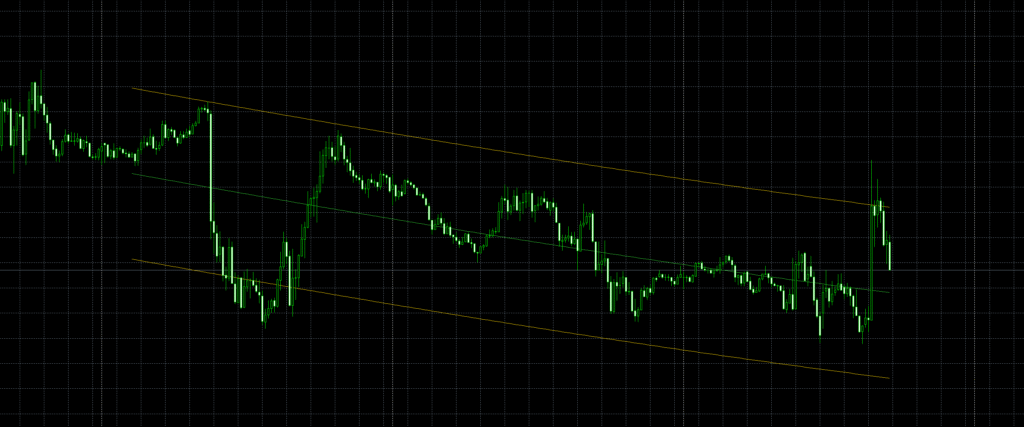
This MT4 indicator fits a polynomial curve to recent price data and draws three lines:
- the regression fit (central line),
- an upper band,
- and a lower band,
where the bands are offset by a multiple of the standard deviation of residuals (the distance between price and the fitted curve). In practice, you get a smooth, adaptive channel that reflects the current trajectory of price and the typical variability around that path.
Because it uses a polynomial rather than a simple linear fit, the center line can curve with the market—often tracking swings and momentum shifts more naturally than a straight regression.

Download this Indicator for MT4
You can download both the ready-to-use EX4 file and the editable MQ4 source code for free below.
How it works
- The indicator polynomial regression channel looks back over a fixed number of bars (your bars setting).
- It performs a least-squares polynomial fit of a chosen degree to the Close price series.
- That fitted line becomes the fx buffer (the middle line).
- It calculates the standard deviation of residuals (price minus fit) and multiplies it by kstd to get a band distance (sq).
- It draws sqh = fx + sq (upper band) and sql = fx − sq (lower band).
- The whole trio can be shifted forward/back with shift to suit your viewing preference.
Under the hood, the code builds and solves the normal equations (via a small matrix and Gaussian elimination) to get the polynomial coefficients. Then it evaluates the curve across the window and adds/subtracts the deviation to form the channel.
Why traders like regression channels
- Smoother trend read: The center line reduces noise and shows the dominant path of price.
- Context for entries/exits: Touches or rejections around the bands can hint at exhaustion, pullback completion, or mean-reversion setups.
- Adaptive risk: Band width expands or contracts with recent variance, helping you size stops and targets relative to current volatility.
Inputs & what to set
- degree — The polynomial degree (default 3).
Lower values (2–3) give smooth curves; higher values track swings more tightly but can overfit. - kstd — Band width multiplier (default 2.0).
Use higher values to reduce false “band touches,” lower values to get more frequent signals. - bars — Lookback length (default 250).
Shorter = faster, more responsive channel; longer = smoother, stabler channel. - shift — Visual offset for where the lines appear relative to price (0 = aligned with bars).
- Colors & styles — Central line: LimeGreen; bands: Gold (you can change in MT4’s colors tab).
How to install (MT4)
- Open MT4 → File → Open Data Folder.
- Go to MQL4 → Indicators and place the polynomial regression channel
.mq4or.ex4file there. - Restart MT4 or right-click Indicators → Refresh.
- Drag the indicator onto any chart and adjust degree, kstd, bars, shift as needed.
- Optionally tweak line colors and thickness in the Colors tab.
Practical ways to trade polynomial regression channel
Mean-reversion pullbacks:
- In an up-bias channel (center line sloping up), look for price dips to the lower band followed by bullish rejection (wicks/bullish candle close) to enter long.
- In a down-bias channel, look for rallies to the upper band with bearish rejection to enter short.
Breakout continuation:
- Strong closes outside a narrow channel can signal momentum continuation. Confirm with structure (HH/HL for longs, LH/LL for shorts).
Confluence check:
- Combine with swing structure, RSI/MACD divergence, or higher-timeframe trend to filter weak signals.
- Use the band distance as a guide to stop placement (e.g., just beyond the band) and take-profit multiples.
Timeframe tips:
- Intraday scalps: M5–M15 with smaller bars (100–200) and modest degree (2–3).
- Swing trades: H1–H4 with larger bars (250–500) and degree 2–3 for stability.
Tuning advice for polynomial regression channel
- Start simple: degree = 2 or 3, kstd = 2.0, bars = 250.
- If the channel looks too “wiggly,” reduce degree or increase bars.
- If signals feel late, reduce bars a bit.
- If you get too many band touches, increase kstd.
Back-test changes one at a time on your pair/timeframe before going live.
Limitations to respect
- Overfitting risk: High polynomial degrees can “hug” price and create deceptive curves.
- Repaints within the window: As new bars arrive, the fitted curve for the last bars can shift because the regression recalculates on the rolling window. Treat signals with confirmation.
- No direction guarantee: Bands show dispersion, not future direction. Always pair with structure and risk management.
FAQ
Does it repaint?
The fit recomputes on the rolling window, so the most recent few bars of the curve can adjust as new data comes in. The historical portion is stable.
Which degree is best?
Most traders stick to 2 or 3. Higher degrees can look impressive but often overfit and reduce robustness.
Is it heavy on CPU?
It’s lightweight—matrix size is tiny (degree+1) and loops are bounded by your bars input.
Can I use Open/High/Low instead of Close?
This version fits to Close. You could adapt it to other prices, but Close is standard for regression fits.
Will it work with any Forex pair?
Yes—any MT4 symbol and timeframe. Just tune inputs to the instrument’s volatility and your style.
Download this Indicator for MT4
You can download both the ready-to-use EX4 file and the editable MQ4 source code for free below.