Polynomial Regression Channel for MT5 — Smooth Trend Line with Deviation Bands
Download the Polynomial Regression Channel indicator for MetaTrader 5 (MT5).
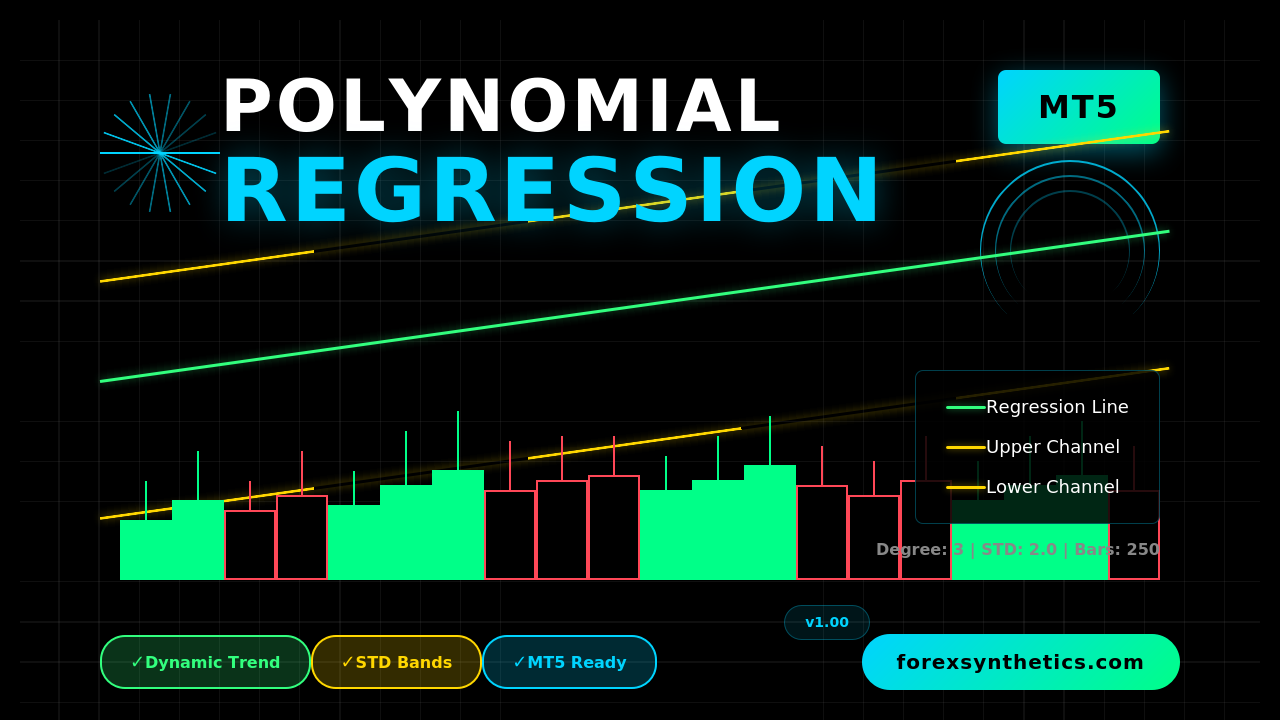
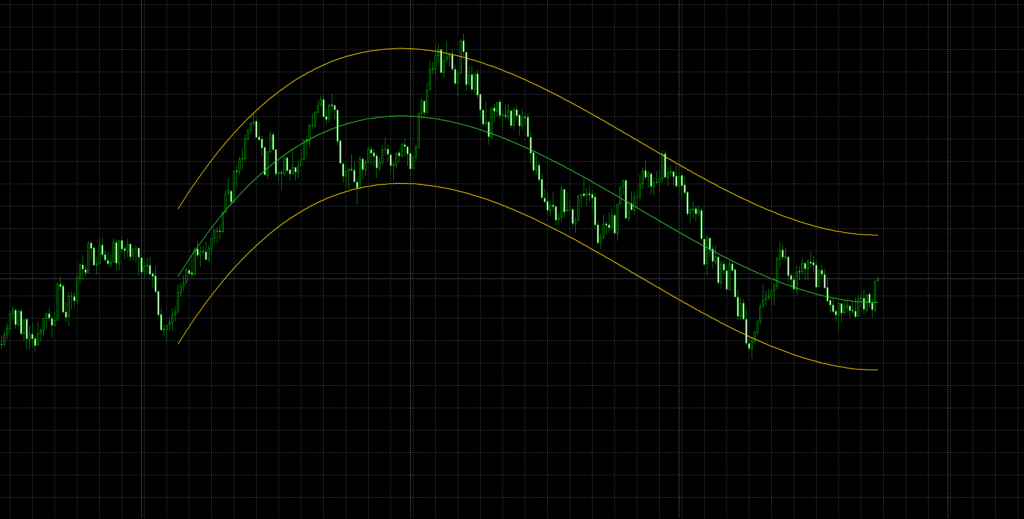
It plots a curved regression line with upper and lower standard-deviation bands to reveal trend direction and volatility. Fully customizable degree, look-back, and band width.
Unlike typical regression or moving-average tools that smooth data mechanically, this indicator fits its levels directly to real price movement, creating a clean, adaptive channel that responds instantly to changing volatility. Whether you trade major Forex pairs, commodities like gold and silver, or synthetic markets, it automatically adjusts to the character of each instrument, keeping your analysis both precise and responsive
Trusted Brokers for MT5 Traders
To get the most accurate results when using MT5 indicators, choose a broker that offers tight spreads, fast execution, and stable MetaTrader 5 servers. Below are our recommended partners that work seamlessly with advanced charting and EA testing.
Both brokers provide MetaTrader 5 (MT5) support, multi-device access, and smooth integration with custom indicators and Expert Advisors.
Overview
The Polynomial Regression Channel for MT5 is a refined trend-analysis indicator that fits a smooth polynomial curve through recent price data.
Unlike linear regression tools, it models natural market curvature — helping traders visualize momentum turns and volatility envelopes in real time.
The indicator plots:
- a central regression line following the fitted curve,
- an upper band, and
- a lower band,
each reflecting the current direction and spread of price movement.
Download this Indicator for MT4
You can download both the ready-to-use EX4 file and the editable MQ5 source code for free below.
How it Works
- The algorithm gathers the last N bars (your bars input).
- It calculates a least-squares polynomial of a chosen degree (default = 3) that best fits closing prices.
- The resulting fitted line becomes the main channel line.
- It then computes the standard deviation of residuals (distance between price and fit) and multiplies it by kstd to create upper and lower offset bands.
- You can shift the whole structure forward/back with shift to align visually with candles.
The output:
A curved, adaptive regression channel that mirrors both trend slope and market rhythm — tighter in consolidation, wider in volatility.
Key Advantages
✅ Dynamic trend visualization — identifies real-time direction without lag from fixed averages.
✅ Adaptive volatility control — band width automatically adjusts to price dispersion.
✅ Configurable curvature — choose polynomial degree (1–5) to fine-tune smoothness.
✅ Custom styling — pick colors, widths, and shift offset for clarity.
✅ Works on any MT5 symbol — Forex, metals, indices, crypto, or CFDs.
Inputs Explained
The Polynomial Regression Channel for MT5 is highly customizable, allowing you to fine-tune its behavior and appearance to match your trading style.
- Degree — This defines how curved the regression line will be. A lower degree (like 2 or 3) gives a smooth, stable curve suitable for trend visualization, while higher degrees make the line more sensitive to short-term fluctuations.
- KSTD (Standard Deviation Multiplier) — Controls how far the upper and lower bands are drawn from the central regression line. The default value of 2.0 is balanced for most markets, but you can increase it to make wider, calmer channels or decrease it for tighter, more aggressive setups.
- Bars — Specifies how many candles the indicator analyzes for each regression calculation. The default of 250 bars offers a good balance between responsiveness and smoothness. Shorter values react faster but may produce more noise; longer values smooth out fluctuations but respond slower.
- Shift — Moves the entire channel forward or backward on the chart for better visibility or alignment with price action. It doesn’t change calculations—only the position of the lines.
- Colors and Styles — By default, the central regression line appears in LimeGreen, and the upper and lower deviation bands in Gold. You can freely adjust these colors and line widths in the MT5 settings to fit your chart theme or personal preference.
Each parameter works together to balance smoothness, precision, and visual clarity—giving you full control over how the indicator displays market structure.
How to Install on MT5
- Open MetaTrader 5 → File → Open Data Folder
- Navigate to MQL5 → Indicators
- Copy the downloaded file PolynomialRegressionChannel.mq5 or .ex5 into that folder
- Restart MT5 or right-click Indicators → Refresh in the Navigator
- Drag the indicator onto your chart
- Adjust degree, bars, and kstd until the channel matches your trading style
The three lines (center, upper, lower) will appear instantly and update with every new bar.
Practical Trading Uses
1️⃣ Trend Continuation
When price hugs the central or upper band in an uptrend, it often signals strong momentum.
Use pullbacks toward the mid-line as continuation entries.
2️⃣ Mean Reversion
In sideways conditions, touches of the outer bands can highlight exhaustion zones — ideal for short-term counter-moves back toward the mid-line.
3️⃣ Breakout Detection
If bands narrow sharply and price bursts through either side with volume, it may indicate volatility expansion and a potential breakout.
4️⃣ Stop/Target Guidance
Band width represents typical deviation. You can base stops just outside the outer band and set profit targets near the opposite band.
Best Practices & Tips
- Start simple: degree = 3, kstd = 2.0, bars = 250.
- Lower degrees (2–3) = smoother long-term curve.
- Higher degrees (4–5) = more reactive intraday fit.
- Increase bars for more stability; decrease for faster response.
- Combine with RSI, MACD, or price-action zones for confirmation.
- Avoid reading a single band-touch as a standalone trade signal.
Limitations
- Repainting of last few bars: Since the regression refits each bar, the curve for the latest section can shift as new data arrives.
- Lag vs. price spikes: Sudden shocks may temporarily distort the fit.
- Overfitting risk: High polynomial degrees can track noise rather than trend.
- No directional forecast: The channel adapts to price — it doesn’t predict it.
Use it for structure and volatility context, not for blind signal entries.
FAQ
Does it repaint?
Only the newest few bars adjust slightly as new data recalculates; past data remains stable.
Which timeframes work best?
Any — but H1–H4 are popular for trend clarity, M15–M30 for scalping.
Is it CPU-heavy?
No. The polynomial matrix is small, so it runs efficiently even on multi-chart setups.
Can it be used in EAs?
Yes — buffers return values of fx, sqh, and sql. You can access them directly in MQL5 code
Conclusion
The Polynomial Regression Channel for MT5 transforms raw price data into a visually intuitive model of trend and dispersion.
Its curved regression line tracks the market’s natural rhythm, while its adaptive deviation bands outline realistic extremes.
Use it to read context, filter noise, and refine timing — whether you trade short-term volatility or long-term trends.
Download this Indicator for MT4
You can download both the ready-to-use EX4 file and the editable MQ5 source code for free below.