FX5 Divergence v2.1 Indicator for MT5 — Detect Hidden and Classic Divergences Automatically
The FX5 Divergence v2.1 Indicator is a refined MetaTrader 5 (MT5) tool that helps traders identify hidden and classic divergences between price and the OSMA (Moving Average of Oscillator). This version is optimized for accuracy, clean visuals, and ease of use, making it one of the most efficient divergence detection indicators for both forex and synthetic indices.
What is the FX5 Divergence v2.1 Indicator?
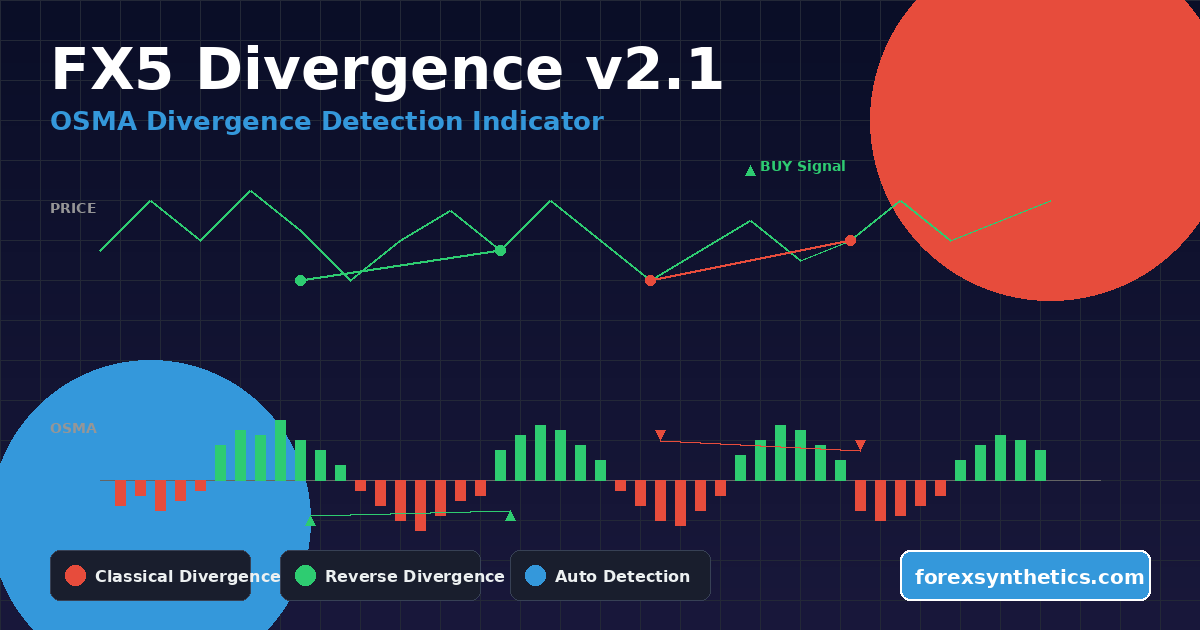
The FX5 Divergence v2.1 plots divergences directly on your chart using colored histogram bars and arrows. It automatically analyzes price and oscillator movement to highlight when momentum is weakening or reversing — key turning points that often precede strong market moves.
By comparing OSMA peaks and troughs against price highs and lows, the indicator identifies both classical divergences (momentum confirming reversal) and reverse divergences (momentum confirming continuation).
This tool is particularly useful for swing and reversal traders who rely on visual signals and precise market timing.
Trusted Brokers for Synthetic Indices
For the best trading experience on Synthetic Indices, choose brokers known for fast execution, tight synthetic spreads, and reliable MT5 platforms. Below are our top recommended partners offering secure and consistent synthetic index trading.
Both brokers support MetaTrader 5 (MT5) with synthetic indices such as Volatility 75, Boom & Crash, and Step Index, ensuring accurate execution and smooth EA integration.
Key Features
- ✅ Automatic Divergence Detection — Spots both bullish and bearish divergences on the OSMA without manual analysis.
- ✅ Dual Modes — Recognizes classical and reverse divergence structures.
- ✅ Visual Alerts — Draws colored lines between divergent points and places arrows for confirmation.
- ✅ Customizable OSMA Settings — Choose fast, slow, and signal EMA periods for fine-tuned sensitivity.
- ✅ Non-repainting Structure — Divergences remain fixed once confirmed.
- ✅ Alert System — Optional pop-up alerts to notify when new divergences appear.
- ✅ Compatible With All Assets — Works seamlessly on Forex, Synthetic Indices, Crypto, and Commodities
Download this Indicator for MT5
You can download both the ready-to-use EX5 file and the editable MQ5 source code for free below.
How It Works
The indicator uses the OSMA (Moving Average of Oscillator) formula to track momentum differences between two EMAs and the MACD signal line. When price forms a new high but the OSMA fails to confirm, a bearish divergence appears. When price forms a lower low while OSMA moves higher, it signals a bullish divergence.
FX5 Divergence v2.1 automatically draws connecting lines between these points and places directional arrows to make each signal visually clear. Solid lines represent classical divergences, while dotted lines indicate reverse ones.
Bullish Divergence
Occurs when:
- Price makes a lower low
- OSMA makes a higher low
This suggests that sellers are losing strength and a possible upward reversal is near.
Bearish Divergence
Occurs when:
- Price makes a higher high
- OSMA makes a lower high
This warns of a potential downward reversal as buying momentum weakens.

Reverse Divergences
Reverse divergences serve as continuation signals rather than reversals.
- Reverse Bullish Divergence: price forms a higher low while OSMA forms a lower low.
- Reverse Bearish Divergence: price forms a lower high while OSMA forms a higher high.
These setups often indicate momentum alignment with the main trend and confirm pullbacks instead of reversals.
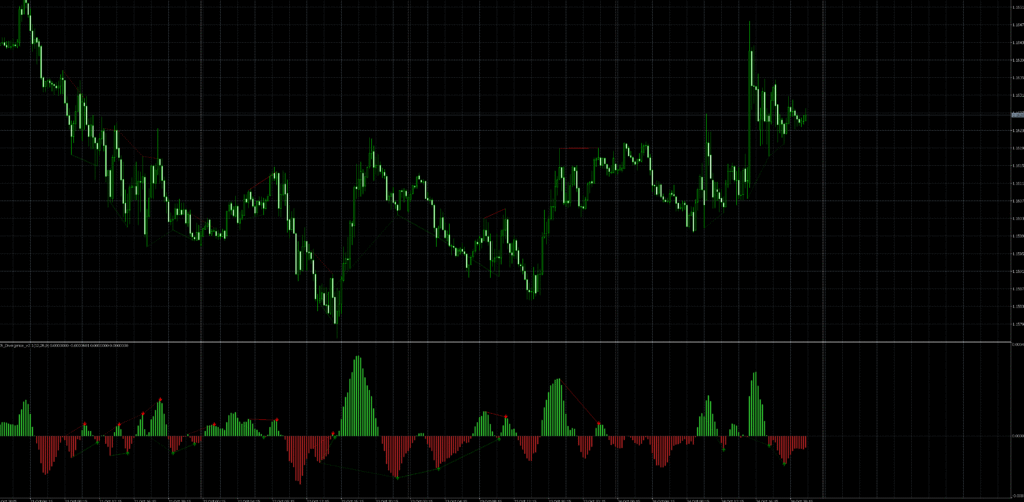
Display and Visualization
The indicator plots a separate OSMA window below your main chart:
- Green Histogram Bars: positive OSMA values showing bullish momentum.
- Red Histogram Bars: negative OSMA values showing bearish momentum.
- Green Arrows: bullish divergence confirmation.
- Red Arrows: bearish divergence confirmation.
- Lines: connect price and OSMA points showing where divergence occurred.
You can enable or disable line drawings for a cleaner layout depending on your preference.
Parameters and Customization
The indicator offers complete flexibility with several input settings:
OSMA Settings
- Fast EMA: defines the short-term momentum period (default 12).
- Slow EMA: defines the long-term trend filter (default 26).
- Signal: sets the smoothing period for confirmation (default 9).
- Applied Price: choose which price source the calculation uses (close, open, high, low, etc.).
Indicator Settings
- Draw Divergence Lines: toggle whether connecting lines are displayed.
- Display Alert: receive an instant alert when a new divergence forms.
How to Use It in Trading
- Attach the indicator to your desired chart and timeframe.
- Wait for divergence arrows or lines to appear.
- Use divergence signals to anticipate potential reversals or confirm existing trends.
- Combine with support/resistance, trendlines, or volume for stronger confirmation.
- Apply multi-timeframe analysis — for example, catch divergence on H1 to trade entries on M15.
Best Timeframes
The indicator works on all timeframes, but higher intervals such as H1, H4, and D1 provide more reliable divergence structures. Scalpers can use M5 or M15 with tighter OSMA parameters for quicker entries.
Advantages of FX5 Divergence v2.1
- Detects momentum shifts before price reverses.
- Helps filter false breakouts and trend exhaustion zones.
- Improves risk-reward ratios by signaling early entries.
- Compatible with Expert Advisors and custom scripts for automation.
- Lightweight and optimized for low CPU use on MT5.
Practical Tips
- Always confirm divergences with price action (candlestick patterns or key levels).
- Avoid trading against strong trend structures without higher-timeframe confirmation.
- Adjust EMA values to match volatility; smaller periods increase sensitivity but may produce more signals.
- Use alerts to catch opportunities without staying glued to charts.
Installation Guide
- Open MetaTrader 5.
- Click File → Open Data Folder → MQL5 → Indicators.
- Copy the file
FX5_Divergence_V2.1.mq5into the Indicators folder. - Restart MT5 or refresh the Navigator.
- Drag FX5_Divergence_v2.1 onto your chart.
- Customize your settings under “Inputs.”
Once loaded, you’ll see the OSMA histogram and divergence markers appear automatically.
Compatible Markets
- Forex Majors & Minors (EURUSD, GBPUSD, USDJPY, etc.)
- Synthetic Indices (Boom/Crash, Volatility 75, Pain and Flip X, etc.)
- Commodities (Gold, Oil, Silver)
- Cryptocurrencies (BTCUSD, ETHUSD, etc.)
The divergence detection algorithm works equally well across all market types due to its universal mathematical nature.
Why Traders Prefer FX5 Divergence v2.1
Traders use it for clear reversal alerts, visual simplicity, and adaptability. Unlike most divergence indicators that repaint or clutter charts, this version keeps signals fixed once confirmed and gives a balanced view of both market structure and momentum dynamics.
It’s ideal for traders who want to combine momentum analysis with price structure recognition without needing multiple indicators.
Trading Strategy Example
A common strategy is to combine FX5 Divergence with a moving average trend filter or support/resistance levels:
- Look for bullish divergence at strong support.
- Wait for a bullish candlestick close above the moving average.
- Enter buy, place stop loss below the divergence low, and target recent resistance.
The same logic applies inversely for bearish setups.
Conclusion
The FX5 Divergence v2.1 for MT5 is an advanced yet user-friendly indicator that simplifies the art of divergence trading. It detects both hidden and classical divergences automatically, helps traders read momentum changes earlier, and visually connects price and oscillator data in an intuitive format.
Whether you’re trading forex, synthetic indices, or cryptocurrencies, this indicator delivers reliable divergence insights that can significantly enhance your timing and accuracy.
Download this Indicator for MT5
You can download both the ready-to-use EX5 file and the editable MQ5 source code for free below.