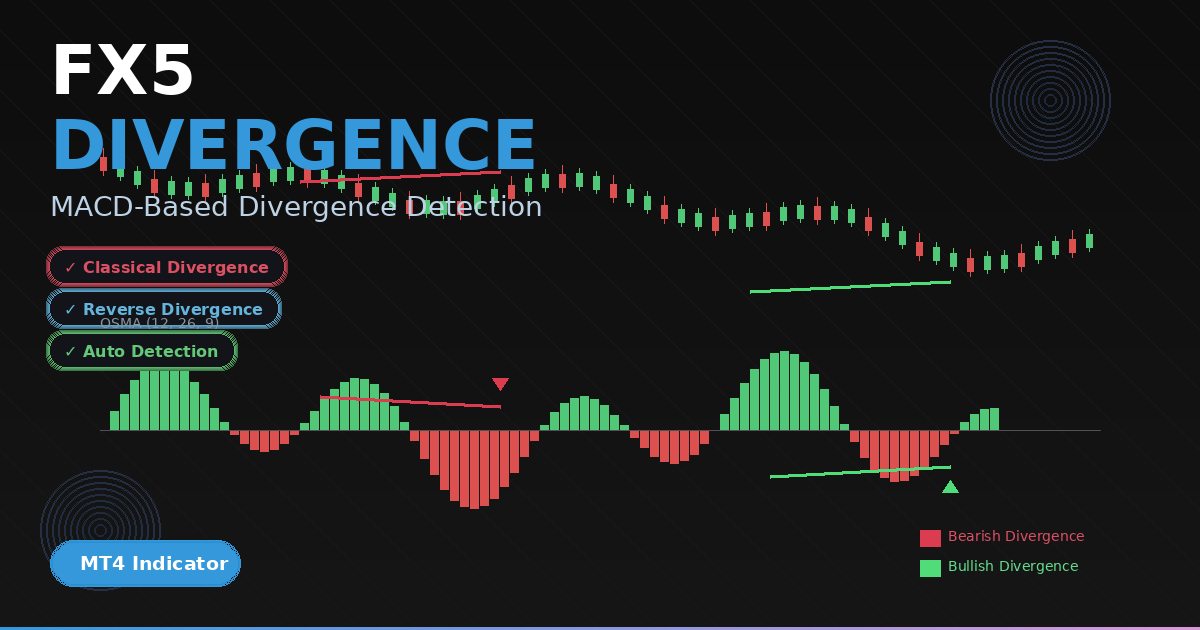
FX5_Divergence — OSMA Divergence Indicator for MT4 (Bullish & Bearish Setup Detection)
The FX5_Divergence indicator detects classical and reverse bullish/bearish divergences between price and OsMA (Moving Average of Oscillator). It highlights potential turning points by comparing price highs/lows to OsMA peaks/troughs, plotting clean arrows and (optionally) drawing matching trend lines on the chart and in the indicator window. With configurable EMA settings and optional alerts, it’s a practical tool for traders who want objective divergence confirmation without clutter.
Recommended Brokers for MT4 Traders
For smooth trading and low spreads, we recommend using one of our trusted partners below. Both brokers support MetaTrader 4 and offer fast execution for Forex and synthetic indices.
What this indicator does
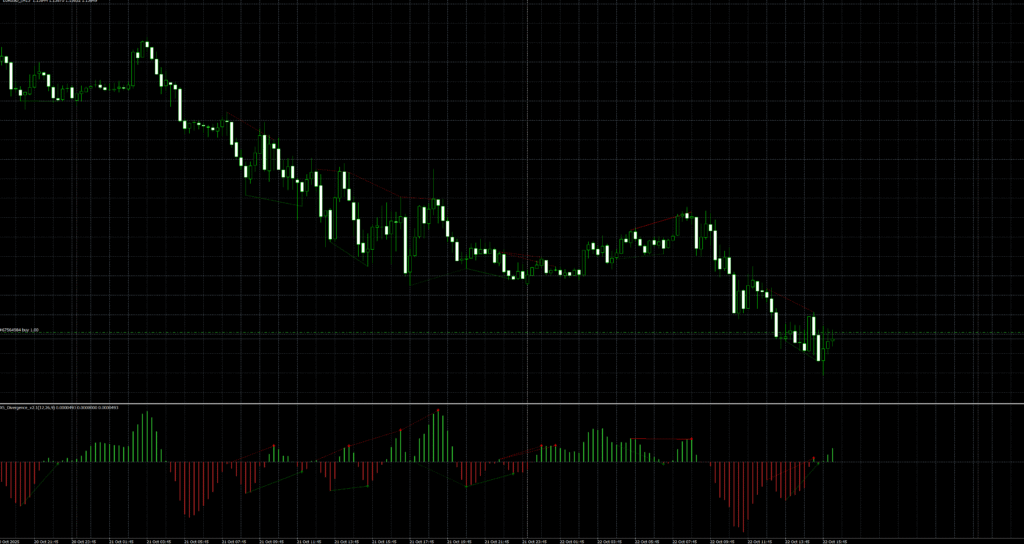
It calculates OsMA from your chosen fast/slow EMA and signal periods, splits the histogram into positive (up) and negative (down) bars for fast visual reading, and continuously checks recent swings for divergence. When a valid pattern appears, it drops a green up arrow for bullish signals or a red down arrow for bearish signals. If enabled, it also draws two synchronized lines: one on price connecting the two relevant highs/lows, and one on the OsMA window connecting the corresponding peaks/troughs.
How it works (inside the code)
- OsMA calculation: Uses iOsMA with
fastEMA,slowEMA, andsignal(defaults 12/26/9). Positive values are placed into the up buffer; negatives into the down buffer. - Peak/Trough detection:
- Peaks require OsMA above zero and a local maximum compared with neighbors, then a forward check to avoid premature signals.
- Troughs require OsMA below zero and a local minimum with a similar forward check.
- Divergence rules:
- Bullish classical: OsMA makes a higher low while price makes a lower low.
- Bullish reverse: OsMA lower low while price makes a higher low.
- Bearish classical: OsMA lower high while price makes a higher high.
- Bearish reverse: OsMA higher high while price makes a lower high.
- Signals and lines: When a rule matches, the indicator plots an arrow and, if
drawDivergenceLines = true, it draws a line between the two price swings and another between the two OsMA swings (solid for classical, dotted for reverse). - Alerts: If
displayAlert = true, it triggers an alert only when the setup is near the most recent bars (to reduce noise).

Download the Indicator for MT4
You can download both the ready-to-use EX4 file and the editable MQ4 source code for free below.
Inputs
- fastEMA (default 12)
- slowEMA (default 26)
- signal (default 9)
- drawDivergenceLines (true/false)
- displayAlert (true/false)
Visual elements
- Positive OsMA histogram bars: Lime/Green
- Negative OsMA histogram bars: Firebrick/Red
- Bullish divergence arrow: Wingdings 233
- Bearish divergence arrow: Wingdings 234
- Optional divergence lines on price and indicator windows
Installation (MT4)
- Open MetaTrader 4 → File → Open Data Folder.
- Go to MQL4 → Indicators.
- Paste
Divergenceinficator .mq4 or the compiled.ex4into the Indicators folder. - Restart MT4 or right-click Navigator → Refresh.
- Drag “FX5_Divergence_V2.1” from Navigator → Indicators → Custom onto your chart.
- Adjust inputs, click OK.
How to use it
- Wait for a divergence indicator arrow. Classical patterns (solid lines) tend to be more reliable than reverse (dotted) patterns.
- Use higher-timeframe trend or structure as a filter. Favor bullish divergences in established uptrends and bearish divergences in downtrends.
- Confirm with confluence: price action at key levels, session timing, or a volatility measure (ATR).
- Consider entries on bar close to avoid intra-bar flicker.
- Manage risk with stops beyond the divergence swing and take-profits at nearby structure or R multiples.
Example playbook
- Bullish classical divergence indicator: Price prints a lower low but OsMA forms a higher low, green arrow prints. Enter long after candle close; stop below the divergence low; scale out at prior swing highs.
- Bearish classical divergence indicator: Price prints a higher high but OsMA forms a lower high, red arrow prints. Enter short after candle close; stop above the divergence high; cover near structure.
- Reverse divergences can signal early slowdowns; require extra confirmation.
Best practices
- Test and tune fast/slow/signal periods for your instrument and timeframe.
- On lower timeframes, consider stricter filters (e.g., only classical divergences, or require an engulfing/structure break).
- Avoid trading directly into major news; divergences indicator can get overwhelmed by liquidity bursts.
- Keep charts tidy: enable line drawing only when you need visual study.

Pros
- Objective, code-driven divergence detection.
- Optional synchronized lines for quick study and screenshots.
- Alerts only when signals form near the most recent bars.
- Lightweight and responsive across symbols/timeframes.
Limitations
- Like all divergence indicator tools, signals can fail in strong trends or during news.
- Peak/trough logic aims to reduce noise but is not foolproof on very low timeframes.
- Reverse divergences are more “early warning” than stand-alone entries.
FAQ — FX5_Divergence_V2.1 (OSMA Divergence) for MT4
Signals are evaluated on completed bars using fixed peak/trough logic. During a forming candle, arrows may appear or disappear; evaluate on bar close for consistency.
H1–H4 for cleaner divergences; M15 can work with stricter filters. On M1–M5, expect more noise—use higher confluence.
Classical divergence opposes price extremes (e.g., higher high in price vs. lower high in OsMA) and often signals reversals. Reverse divergence is an early warning of momentum changes—use more confirmation.
Yes. Edit SetIndexArrow codes (e.g., 233/234) and color properties. You can also toggle line drawing and alerts via inputs.
Download the Indicator for MT4
You can download both the ready-to-use EX4 file and the editable MQ4 source code for free below.