Reversal, Supply & Demand Indicator for MT4 (with Source Code)
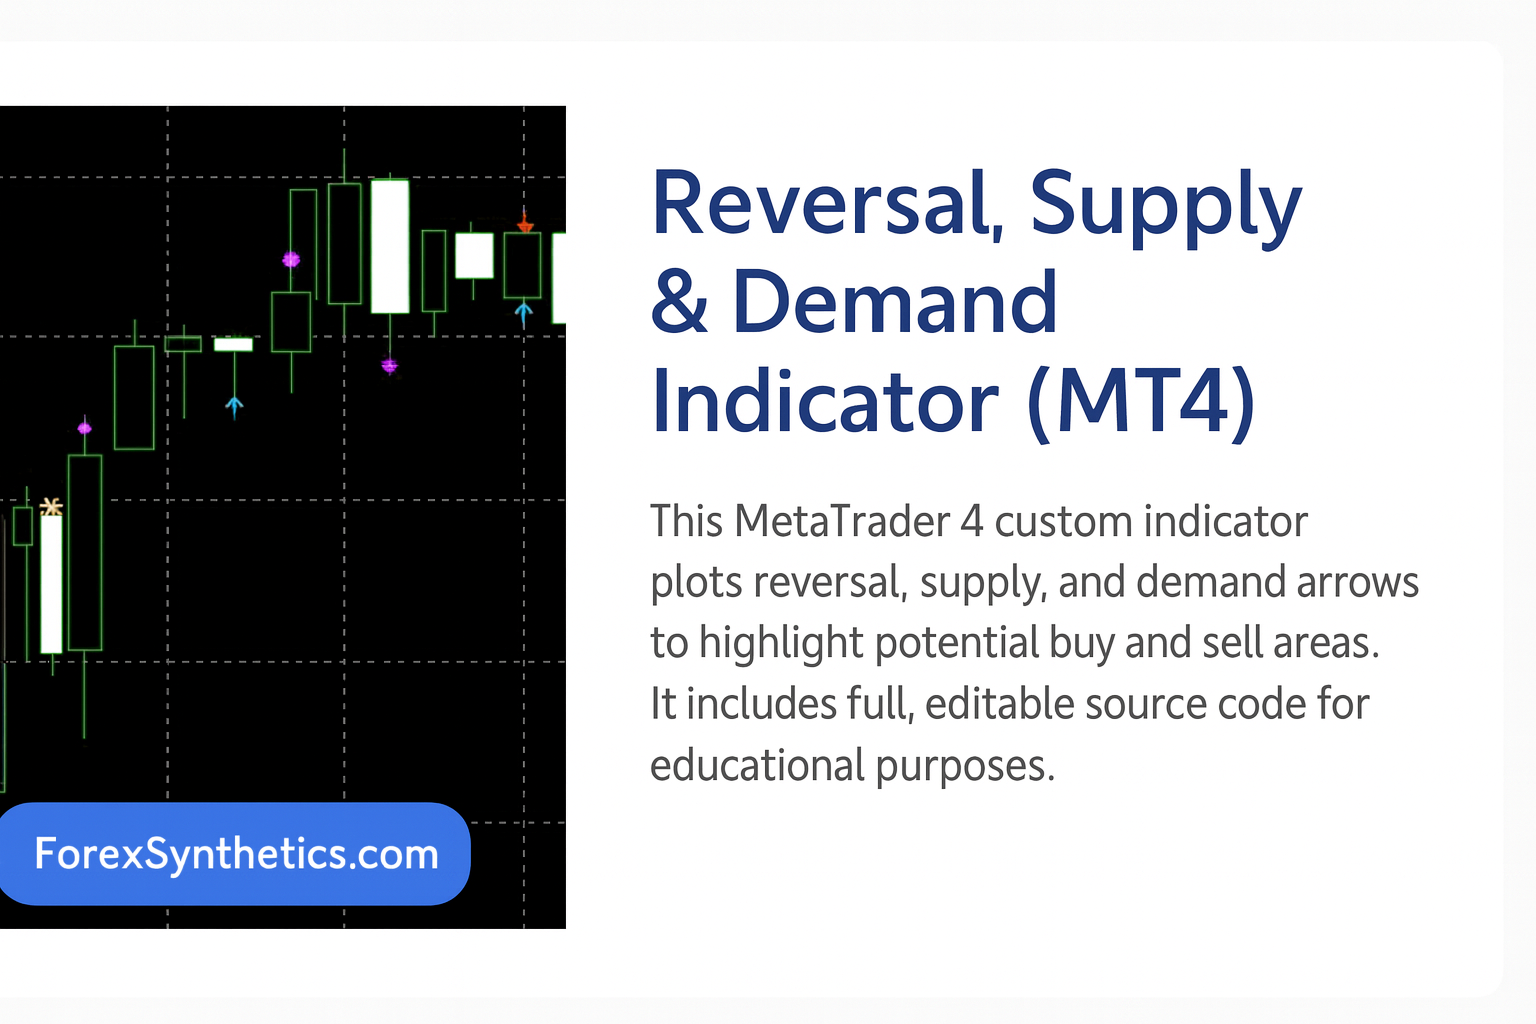
The Reversal, Supply & Demand Indicator for MT4 is a price-action-based tool designed to help traders identify potential turning points in the market. Using a combination of candle range, volume behavior, and bar-to-bar volatility, it plots colored arrows on your chart that represent possible Reversals, Supply Zones, Demand Zones, and Warning Points.
Unlike typical repainting or lagging indicators, this one works directly on candle data and relative volume shifts. It detects when volatility expands or contracts and checks how price closes within its range — producing intuitive visual signals for traders who rely on volume confirmation and raw price movement rather than smoothed indicators like RSI or MACD.
What This Indicator Does
This MT4 custom indicator measures the spread (high minus low) and compares it with the previous bar’s spread and volume. Based on these relationships, it determines whether buyers or sellers are losing momentum and whether the current candle could mark the start of a reversal or continuation.
The logic uses four buffers:
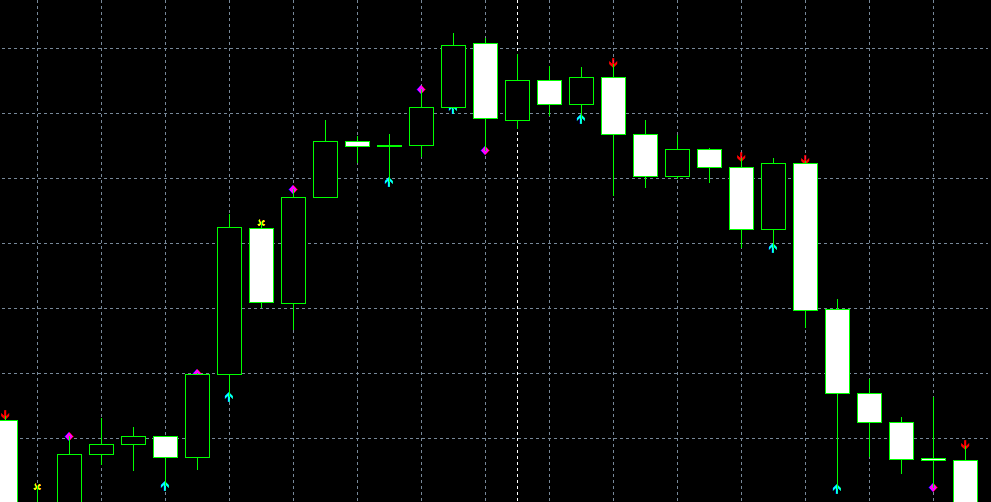
- Reversal (Magenta Arrows) – Plotted when price shows a potential turning point supported by falling volume or a narrowing spread.
- Demand (Aqua Arrows) – Indicates strong buying interest and potential upward movement from lower price levels.
- Supply (Red Arrows) – Highlights regions of selling pressure where price may face resistance.
- Warning (Yellow Arrows) – A cautionary signal suggesting possible slowdown or false breakout conditions.
Each arrow color corresponds to one of these signals, helping traders instantly recognize when market momentum changes.
How It Works Internally
Candle Spread Comparison
The indicator calculates the difference between the high and low of each of the last two bars, stored as spd1 and spd2.
When the current bar’s spread is greater than the previous one, it shows rising volatility and active price expansion.
When the spread becomes smaller than the previous bar, it indicates contracting volatility, often a sign of indecision or a short pause before a breakout.
Volume Comparison
The function iVolume() checks the total traded volume of the last two candles.
If the most recent bar’s volume is higher than the previous, it means market participation is increasing — momentum is building.
If the new bar’s volume is lower, it signals reduced activity and weakening strength.
Combined Logic
By comparing these two readings — volatility and volume — the indicator decides who is currently in control: buyers or sellers.
When specific conditions align, it plots a color-coded arrow directly on the chart to mark the situation.
A small offset value (default 5 points) ensures that the arrows appear clearly above or below each candle, so signals remain visible even during dense chart activity.
Key Features
- 🟣 Reversal arrows appear where potential trend changes may occur.
- 🔵 Demand arrows signal accumulation or buying interest.
- 🔴 Supply arrows highlight areas of potential distribution or selling pressure.
- 🟡 Warning markers identify uncertain bars where volatility drops but volume rises.
- Works on all MT4 timeframes and instruments (Forex, metals, indices, synthetics).
- Fully editable MT4 source code for developers to adjust logic, offsets, or arrow types.
- Lightweight and efficient — doesn’t slow down your platform.
- Simple, visual design compatible with dark or light chart themes.
How to Install the Indicator in MT4
- Open MetaTrader 4.
- Go to File → Open Data Folder.
- Navigate to MQL4 → Indicators.
- Paste the downloaded file (e.g.
Reversal_Supply_Demand.mq4). - Restart your platform or right-click Indicators → Refresh in the Navigator window.
- Drag the indicator onto your chart.
- Adjust settings:
NumberOfBars(default 300) controls how many candles back the indicator analyzes.Offset(default 5) sets how far arrows are drawn from candles.
Because the MT4 source code is provided, you can also open the file in MetaEditor and change arrow styles, colors, or logic conditions to better match your trading approach.
How to Use the Reversal, Supply & Demand Indicator
Reading the Arrows
- Magenta (Reversal): Price may be exhausted and near a turn. Confirm with candle patterns or a trendline break.
- Aqua (Demand): Plots below candles where buyers step in; useful for buy setups or pullback entries.
- Red (Supply): Plots above candles where sellers are active; useful for resistance or take-profit zones.
- Yellow (Warning): Signals uncertainty or slowing momentum; wait for the next bar to confirm direction.
Best Practices
- Confirm signals with trend context (e.g., moving averages or higher-timeframe bias).
- Combine with CCI, RSI, or volume profile for stronger confirmation.
- Avoid counter-trend entries unless supported by strong reversal candles.
- Adjust the Offset to suit your instrument’s pip scale or synthetic index.
Timeframe & Strategy Suggestions
- Scalping (M1–M5): Target quick reversals after strong impulsive moves.
- Intraday (M15–H1): Map short-term zones where liquidity builds before breakouts.
- Swing (H4–D1): Use as confirmation for entries after pullbacks or retracements.

Sponsored • Partner Offer
Customization Tips for Developers
Since the indicator is open-source, developers can personalize it easily:
- Replace arrow codes (119, 233, 234, 251) with custom Wingdings symbols.
- Add alert or email notifications when new arrows appear.
- Create different offsets for supply/demand vs. reversal arrows.
- Integrate into Expert Advisors that open trades automatically based on these signals.
- Combine logic with ATR or Bollinger Band filters to avoid false signals during low volatility.
You can also change the color palette for your brand or broker theme (e.g., make Demand green, Supply orange, etc.).
Just edit the #property indicator_color1–4 values at the top of the code.
Example Logic Snippet from the Source Code
if (spd1 > spd2 && v1 < v2)
  if (High[i+1]-Close[i+1] < Close[i+1]-Low[i+1])
    R[i+1] = High[i+1] + Offset; // Reversal Up
This means when the bar spread widens but volume falls and the candle closes near its low, momentum is fading — a reversal may be forming.
Similarly:
if (spd1 < spd2 && v1 > v2)
  W[i+1] = High[i+1] + Offset; // Warning
Here, decreasing spread with higher volume indicates compression or fake breakouts — a warning not to enter impulsively.
Advantages of This Indicator
- Helps visualize volume-based reversals easily.
- Can confirm breakouts or trend exhaustion without extra indicators.
- Works across multiple assets including Forex, indices, crypto, and synthetic markets.
- Customizable for both discretionary and algorithmic trading.
- Offers an educational insight into how spread-volume analysis can predict reversals.
Installation & Learning
New to MT4 custom indicators? These quick guides walk you through adding
.mq4 and .ex4 files and basic platform use.
About
This tool plots clear signals for potential reversals (magenta), demand (aqua), supply (red), and early warnings (yellow). It’s lightweight, easy to read on any timeframe, and comes with editable source code so you can adapt arrow types, offsets, or logic to your strategy.