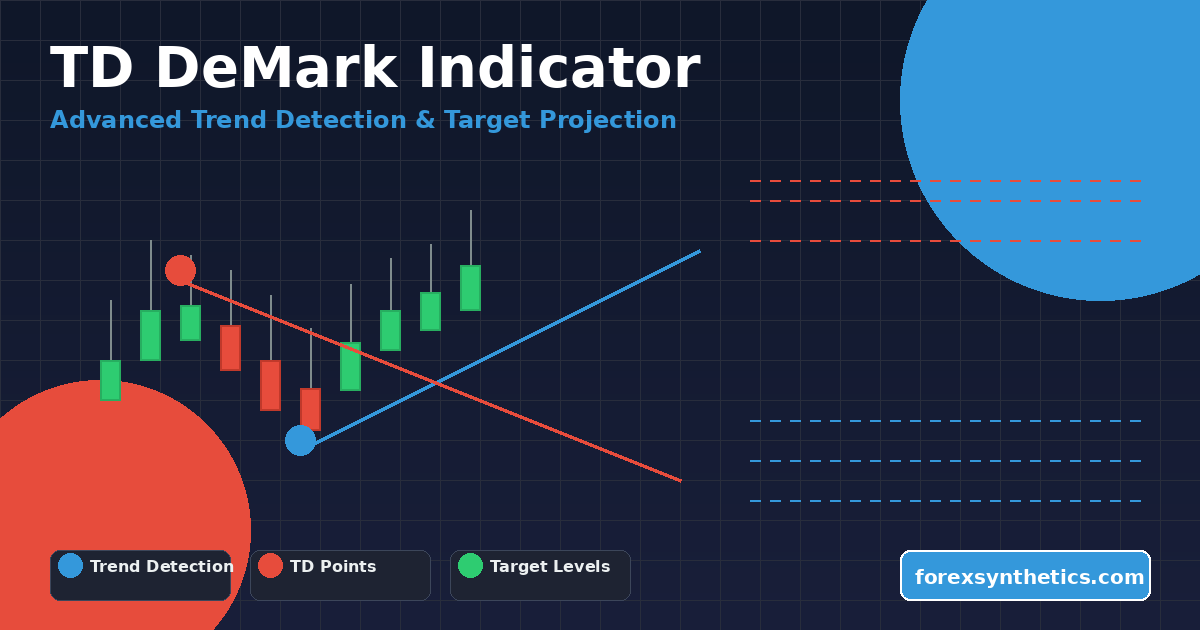
TD DeMark Levels for MT5 — Automatic TD Points, Break Lines & Target Projections
Download TD DeMark Levels for MT5 — an advanced indicator that marks Tom DeMark–style swing points (TD High / TD Low), draws dynamic up- and down-trendlines, plots horizontal reference levels, and auto-projects upside/downside targets once a line breaks.
This MT5 version is fast, object-driven, and highly visual: you can toggle fractal-based detection, turn lines on/off, show multiple “steps” (older sequences) at once, and display a compact on-chart commentary with the exact prices for break levels and the T1/T2/T3 projections.
Trusted Brokers for MT5 Traders
To get the most accurate results when using MT5 indicators, choose a broker that offers tight spreads, fast execution, and stable MetaTrader 5 servers. Below are our recommended partners that work seamlessly with advanced charting and EA testing.
Both brokers provide MetaTrader 5 (MT5) support, multi-device access, and smooth integration with custom indicators and Expert Advisors.
What this indicator does
The TD DeMark Levels for MT5 indicator scans price to identify TD High and TD Low points — local turning points based on DeMark logic. From those anchors, it:
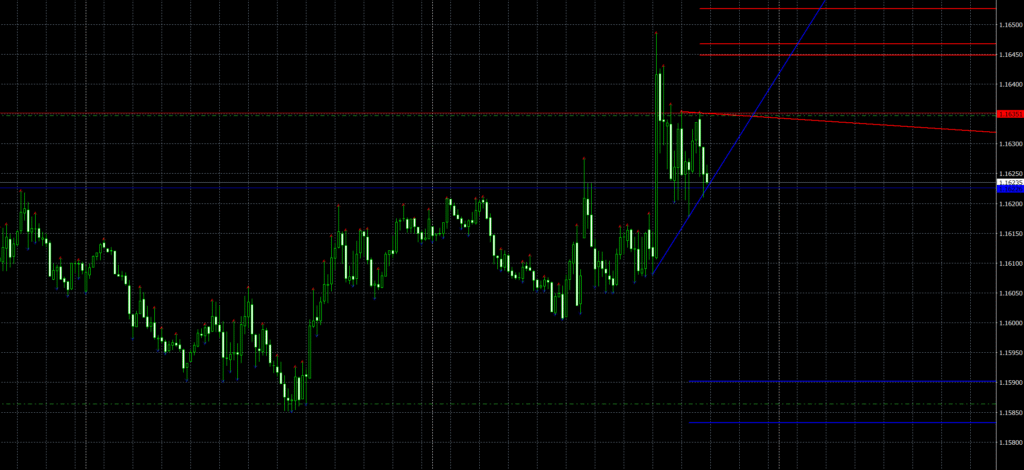
- Connects the most recent two TD Highs (UTD) and two TD Lows (LTD) to form trendlines that project to the right.
- Optionally draws horizontal reference lines at the working step.
- Watches for line breaks (close crossing the UTD/LTD line) and, once a break is detected, projects three targets (T1/T2/T3) using built-in price relationships.
- Prints an on-chart commentary with the current UTD/LTD values, whether a line is broken, and the exact T1/T2/T3 prices (including pip distances).
It’s a complete DeMark-style mapping tool: find the pivot pair → draw the line → react to the break → trade toward measured objectives.
Download this Indicator for MT5
You can download both the ready-to-use EX5 file and the editable MQ5 source code for free below.
How it works
- TD points detection:
By default, the script checks each bar for the DeMark pattern (a bar’s high higher than its neighbors and past close, or a low lower than its neighbors and past close). If you prefer, set FractalAsTD = true to use a stricter 5-bar fractal variant. - “Steps” concept:
Each Step is the current working pair of TD points (newest pair = Step 1; older pairs = Step 2, 3, …). You can display multiple Steps at once with ShowingSteps (max 10). BackSteps lets you shift which generation you start from. - Trendlines & horizontals:
For TD Highs, the indicator draws the UTD (upper) line; for TD Lows, the LTD (lower) line. You can toggle TrendLine and HorizontLine independently. - Break & target logic:
When price closes through a TD line, the code records the break and projects T1/T2/T3 in the break direction. Targets are shown as labeled rays and summarized in the commentary (with prices and pip counts). - Color & emphasis:
Step 1 uses thicker lines; older steps are thinner. Colors alternate for clarity across multiple steps.
Inputs explained
- BackSteps — Start from older TD sequences if you want to analyze prior structures first.
- ShowingSteps — How many sequences to plot (1–10).
- FractalAsTD —
false= classic TD logic;true= stricter fractal detection. - Commen — Turn the on-chart commentary on/off.
- TD —
trueshows arrow glyphs at TD High/Low;falseuses a neutral marker. - TrendLine — Toggle UTD/LTD trendlines.
- HorizontLine — Toggle horizontal reference lines for the newest step.
- TakeProf — Toggle target projection (T1/T2/T3) drawing and commentary.
Installation (MT5)
- In MetaTrader 5, go to File → Open Data Folder.
- Open MQL5 → Indicators and place
Ind-TD-DeMark-3.mq5(or.ex5) there. - Restart MT5 or right-click Navigator → Indicators → Refresh.
- Attach the indicator to any chart and adjust inputs to your workflow.
- Right-click the chart → Properties → Colors if you want a darker/light theme for the lines.

Practical trading uses
- Breakout continuation:
Trade in the direction of a confirmed break of the UTD or LTD, using T1/T2/T3 as take-profit waypoints. Many traders scale out at T1/T2 and trail for T3. - Countertrend inflection:
If price fails to break and returns to the line, watch for a reaction at the UTD/LTD — the line can behave as dynamic S/R. - Multi-step confluence:
Keep ShowingSteps = 2–4 to reveal when older step lines cluster with the current one; clustered lines often mark powerful zones. - Risk placement:
Use the opposite TD line or the break level itself as an invalidation point, adjusted for symbol tick size.
Strengths
- True DeMark logic with optional fractal strictness.
- Automatic targets after a break (clear T1/T2/T3 rays + pip counts).
- Multi-step visualization to keep historical structure in view.
- Clean object management — lines update, obsolete objects cleared.
- Lightweight — runs smoothly on intraday or higher timeframes.
Limitations to respect
- Latest step can evolve: As new highs/lows print, the current TD pair can update until confirmed.
- Not a crystal ball: Lines and targets provide structure and measured objectives, not guaranteed outcomes.
- Low-liquidity spikes: On illiquid ticks, beware of single-bar breaks; prefer closes beyond the line.
FAQ
Does it repaint?
TD point selection for the most recent step can evolve as new bars come in; once a pair is “in the past,” it’s effectively fixed. Always confirm breaks on candle close for reliability.
Which timeframes and symbols?
Any MT5 symbol: Forex majors, metals, indices, crypto, synthetics. Timeframe depends on your horizon — M15–H1 for active trading, H4–D1 for swing.
Can I disable targets?
Yes, set TakeProf = false to show only TD points and lines.
Arrows feel too busy. Solutions?
Set TD = false to neutral markers, or leave TD on and reduce ShowingSteps.

Download this Indicator for MT5
You can download both the ready-to-use EX5 file and the editable MQ5 source code for free below.